Statsmodels STL wrapper
Statsmodels STL wrapper
| Property | Value |
|---|---|
| Method | STL |
| Input mode | univariate |
| Trend shape | (96,) |
| Notebook execution | ran |
| Reconstruction RMSE | 0.00000000 |
Notebook example metric: root mean square of input - (trend + season + residual) over all samples and channels. This checks additive bookkeeping; it is not a forecast error or a component-recovery score. The separate teaching input and intermediate arrays for the animation are linked below.
How it works
Method maturity: stable. Implementation: wrapper.
STL alternates local seasonal and trend smoothing while retaining a residual component.
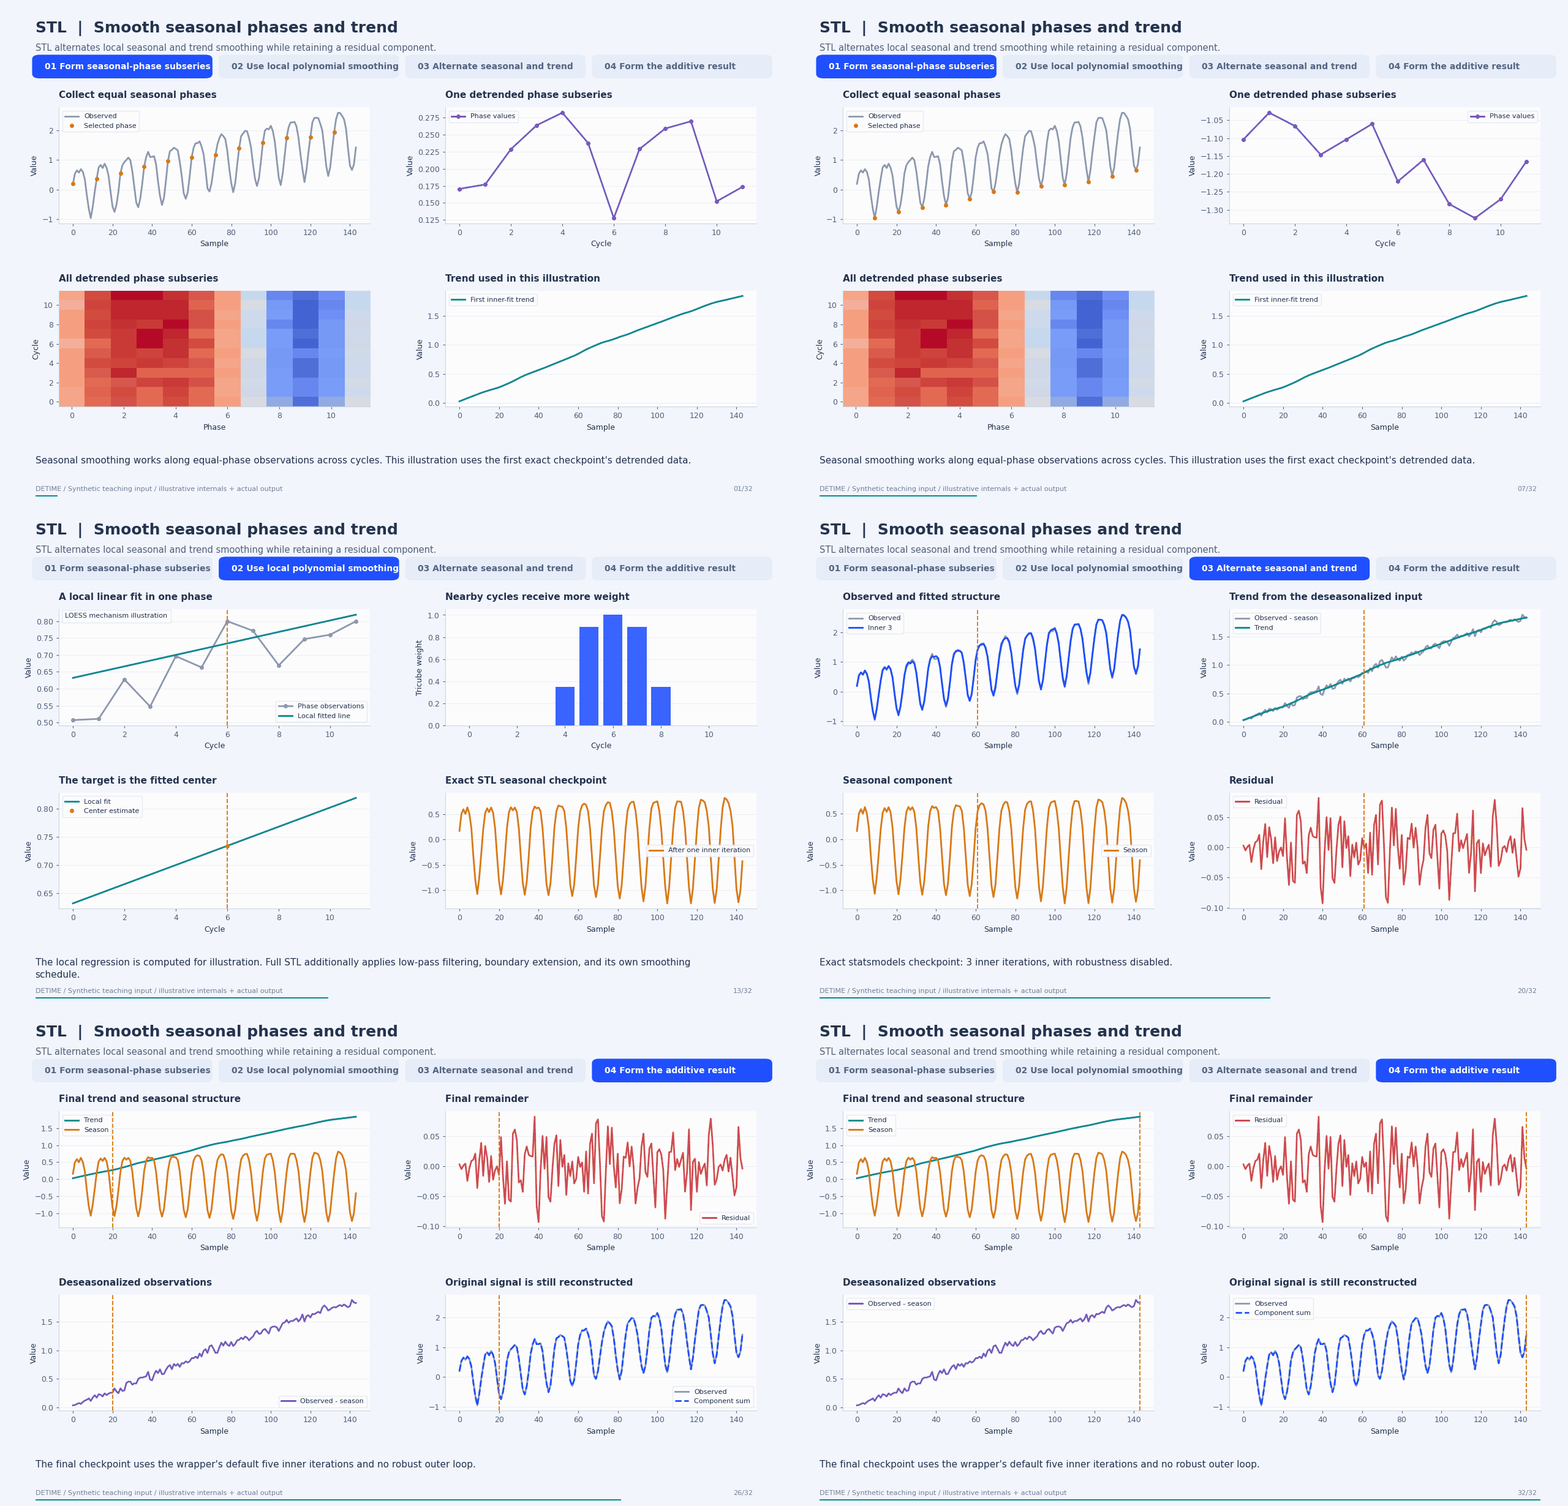
Deterministic synthetic teaching signal; not a benchmark.
Open GIF · Static PNG · Source arrays (NPZ) · Trace metadata
Follow the four steps
1. Form seasonal-phase subseries
After removing the current trend, collect values at the same phase in successive cycles. STL smooths along each of these subseries, allowing the seasonal pattern to vary through the record.
2. Use local polynomial smoothing
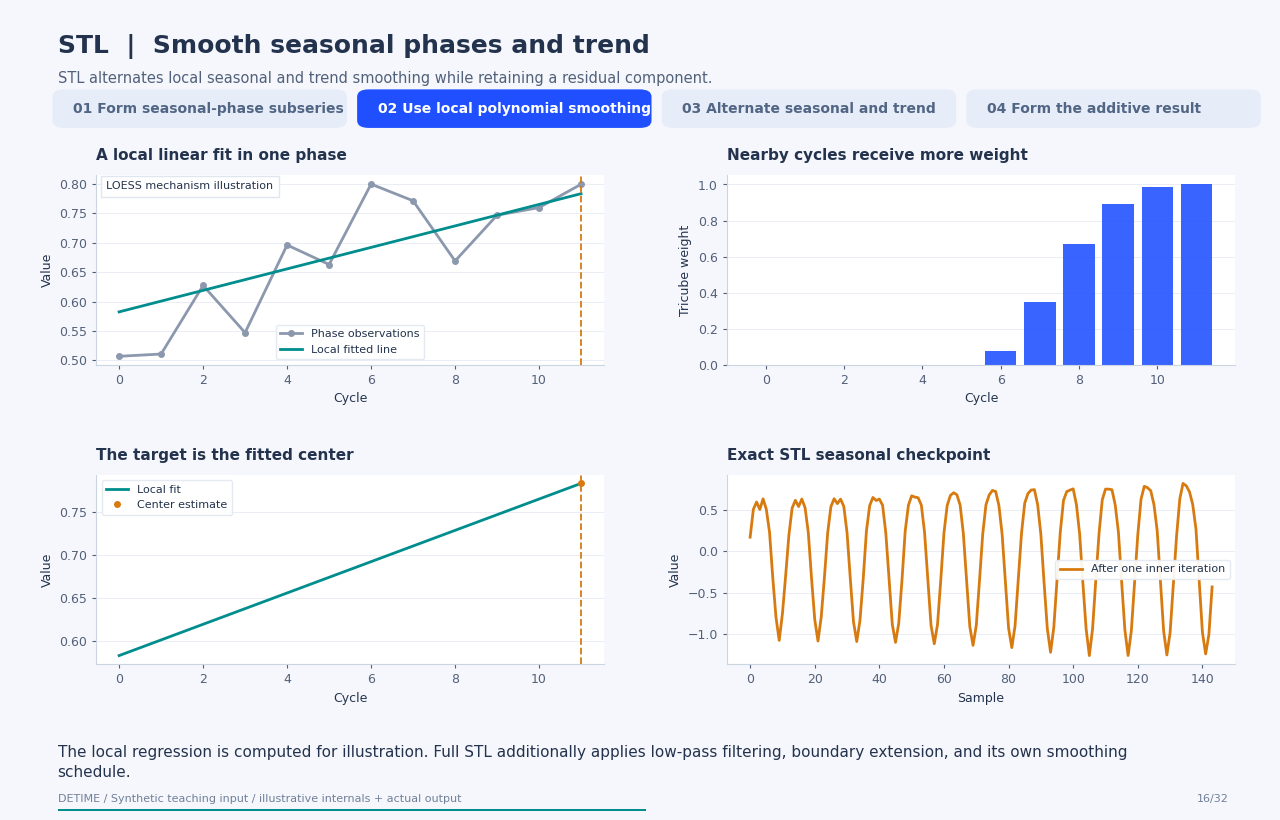
The illustrative panel computes a tricube-weighted local linear fit for one phase. Full STL also extends boundaries, applies low-pass filtering, and combines the smoothed subseries; the illustration is not a replacement implementation of those internals.
3. Alternate seasonal and trend
The seasonal estimate is subtracted to form a deseasonalized series, which is smoothed for trend. The numerical checkpoints come from exact statsmodels fits with one through five inner iterations and no outer robustness loop.
4. Form the additive result
The final five-iteration checkpoint matches the configured DeTime STL wrapper. Residual is the input minus the returned trend and seasonal component. Reconstruction consistency does not validate a unique physical interpretation.
Parameters that change the result
| Parameter | Effect on the computation |
|---|---|
period |
Specified number of samples in a seasonal cycle; this example uses 12. |
seasonal |
Odd LOESS span across cycles for the seasonal subseries; smaller spans allow faster seasonal change. |
trend / low_pass |
Odd smoothing spans controlling trend and low-pass behavior; this example uses 23 and 13. |
robust |
Controls the outer reweighting loop. ROBUST_STL defaults to True; setting it False disables robustness. |
What this animation computes
The local weighted regression illustrates LOESS numerically and omits STL's full low-pass and boundary machinery. Exact statsmodels inner-iteration checkpoints and final DeTime output are shown separately and compared.
Interpretation
- ROBUST_STL is the registry name for statsmodels STL with its robust option. This name does not establish implementation of other published algorithms also called RobustSTL.
- Smoothing spans, seasonal period, endpoint handling, and outliers influence the estimated components.
- The animation uses statsmodels' actual checkpoints. Internal fits are restarted for each budget; frame count is not an execution-time measure.
- STL is an offline smoother. Use only available history when constructing forecasting features.
Try the method
Use this configuration with DecompositionConfig and decompose. The animation generator supplies the teaching input and records intermediate arrays.
{
  "method": "STL",
  "backend": "python",
  "params": {
    "period": 12,
    "seasonal": 7,
    "trend": 23,
    "low_pass": 13,
    "robust": false
  }
}
See the configuration reference for the full interface and optional dependencies.
Sources and reproduction
- Cleveland et al. (1990), STL: A Seasonal-Trend Decomposition Procedure Based on Loess
- statsmodels STL: parameters and implementation contract
- DeTime implementation:
src/detime/methods/stl.py
Regenerate this animation with python scripts/generate_method_animations.py --methods STL.
The reproduction guide explains the environment,
numerical checks, coverage manifest, and how to inspect the stored arrays.
Code
case = CASES["STL"]
run_gallery_case("STL")
Output
STL: Classical STL wrapped into the DeTime workflow contract.
status: ran
input mode: univariate
trend shape: (96,)
backend: python
reconstruction RMSE: 0.00000000
Decomposition Plot
