Empirical mode decomposition
Empirical mode decomposition
| Property | Value |
|---|---|
| Method | EMD |
| Input mode | univariate |
| Trend shape | (96,) |
| Notebook execution | ran |
| Reconstruction RMSE | 0.00000000 |
Notebook example metric: root mean square of input - (trend + season + residual) over all samples and channels. This checks additive bookkeeping; it is not a forecast error or a component-recovery score. The separate teaching input and intermediate arrays for the animation are linked below.
How it works
Method maturity: stable. Implementation: wrapper.
EMD adapts its oscillatory modes to the extrema of the current signal. DeTime then groups upstream modes into its trend/season/residual result.
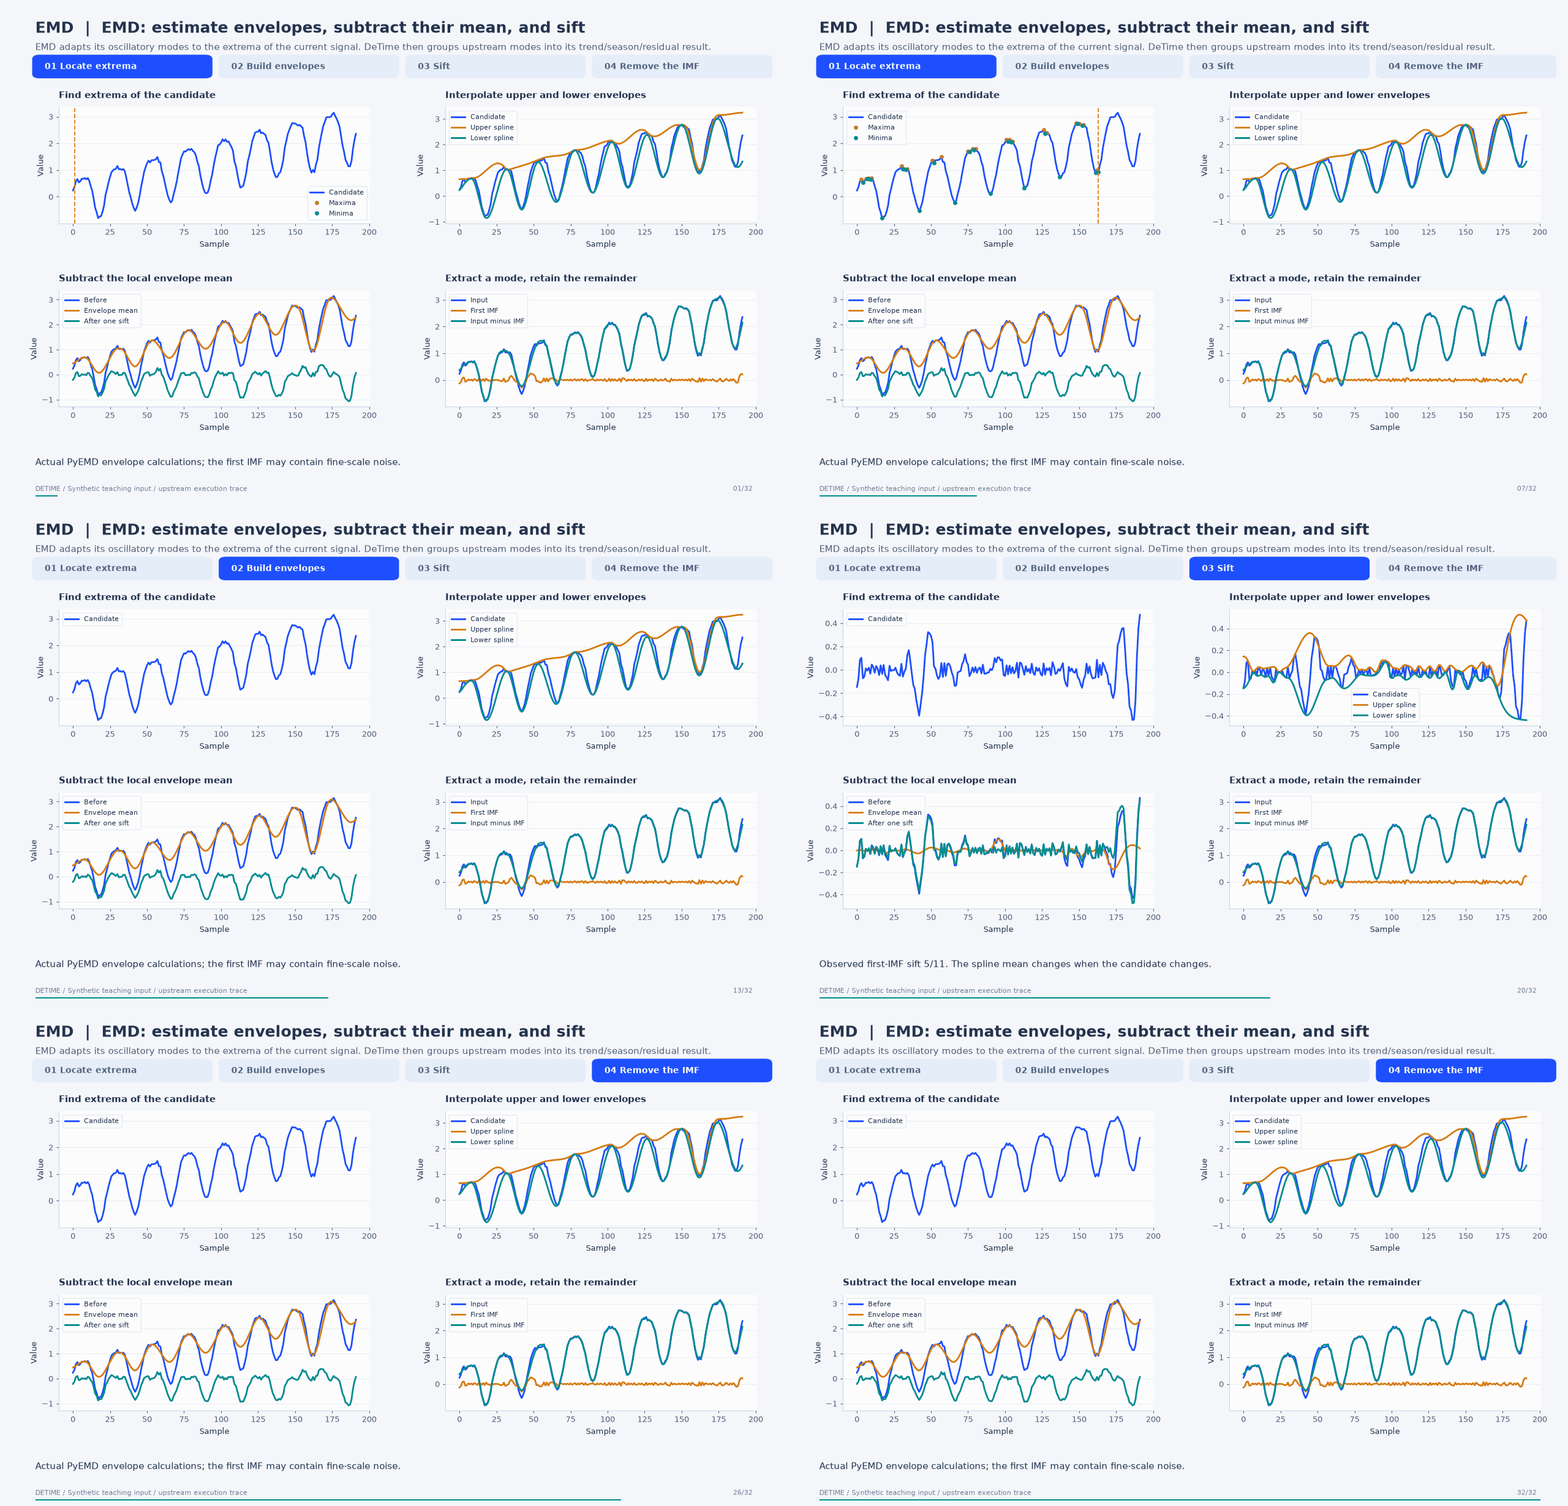
Deterministic synthetic teaching signal; not a benchmark.
Open GIF · Static PNG · Source arrays (NPZ) · Trace metadata
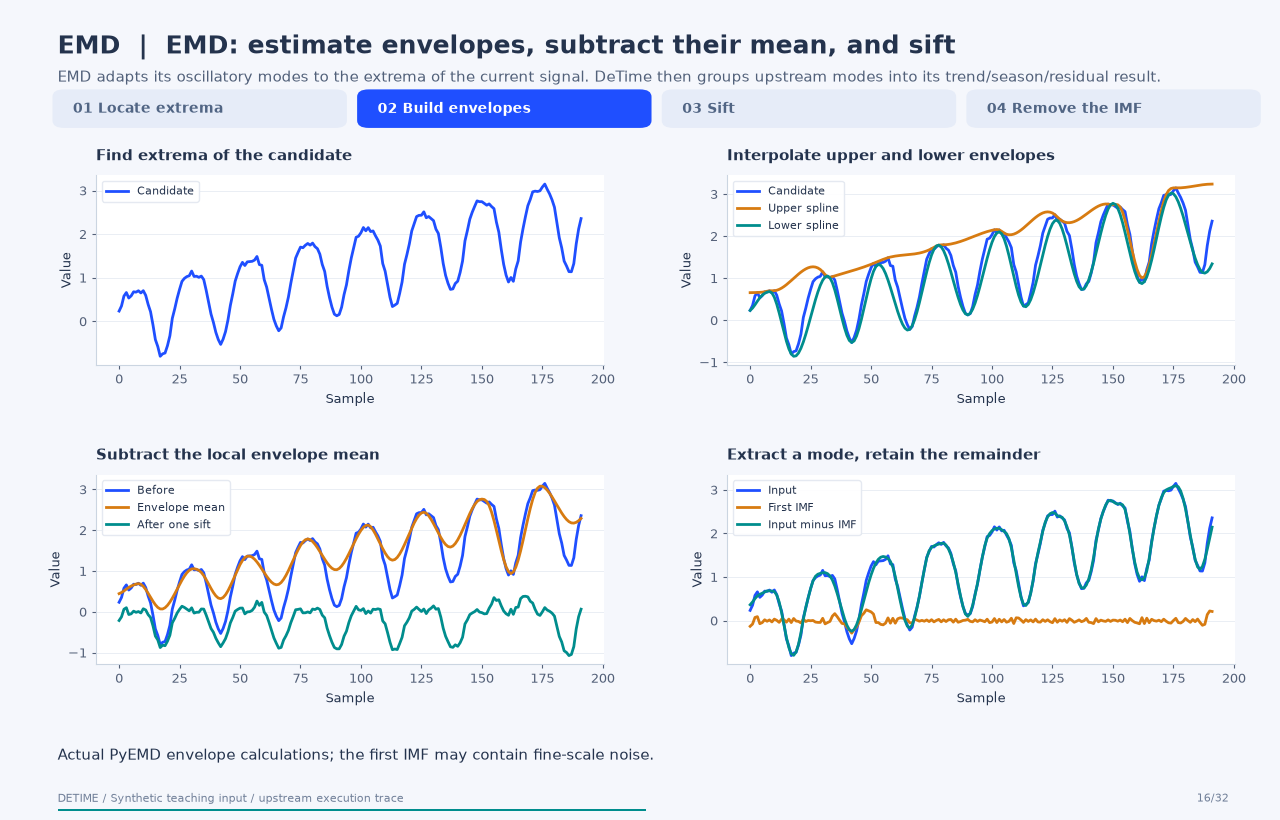
Follow the four steps
1. Locate extrema
Local maxima and minima anchor the envelope construction.
2. Build envelopes
PyEMD interpolates upper and lower envelopes with its boundary treatment.
3. Sift
Subtract their pointwise mean, recompute extrema, and apply the stopping criteria.
4. Remove the IMF
Subtract the accepted mode from the signal and continue on the remainder.
Parameters that change the result
| Parameter | Effect on the computation |
|---|---|
n_imfs |
Limits extracted modes in DeTime's PyEMD call; a final residue can also be returned. |
primary_period / explicit IMF groups |
Controls DeTime's subsequent grouping; it does not determine the sifting envelopes. |
PyEMD stopping criteria |
This trace uses the upstream defaults; DeTime's wrapper exposes a narrower parameter surface. |
What this animation computes
Envelope calls recorded from EMD-signal 1.10.0 with default sifting settings and max_imf=1. All curves are computed; no intermediate curve is interpolated between final results.
Interpretation
- EMD modes are not uniquely identified physical sources; the first mode is not automatically the desired season.
- Spline boundary choices and added observations can change previously estimated components.
- The animation records the first IMF; it does not imply the algorithm stops after one mode.
Try the method
Use this configuration with DecompositionConfig and decompose. The animation generator supplies the teaching input and records intermediate arrays.
{
  "method": "EMD",
  "params": {
    "n_imfs": 3,
    "primary_period": 24
  }
}
See the configuration reference for the full interface and optional dependencies.
Sources and reproduction
- PyEMD EMD algorithm and envelope API
- Huang et al. (1998)
- DeTime implementation:
src/detime/methods/emd.py
Regenerate this animation with python scripts/generate_method_animations.py --methods EMD.
The reproduction guide explains the environment,
numerical checks, coverage manifest, and how to inspect the stored arrays.
Code
case = CASES["EMD"]
run_gallery_case("EMD")
Output
EMD: Empirical mode decomposition under the DeTime result contract.
status: ran
input mode: univariate
trend shape: (96,)
backend: python
reconstruction RMSE: 0.00000000
Decomposition Plot
