Univariate workflows
When to use univariate methods
Use the univariate path when one observed series is decomposed into trend, seasonality, and remainder components.
Good starting methods:
STLwhen the seasonal period is known and the data are reasonably regular,SSAwhen you want a flexible subspace method,STDwhen you want blockwise seasonal-trend-dispersion structure,WAVELETwhen you want a multi-scale signal-processing view.
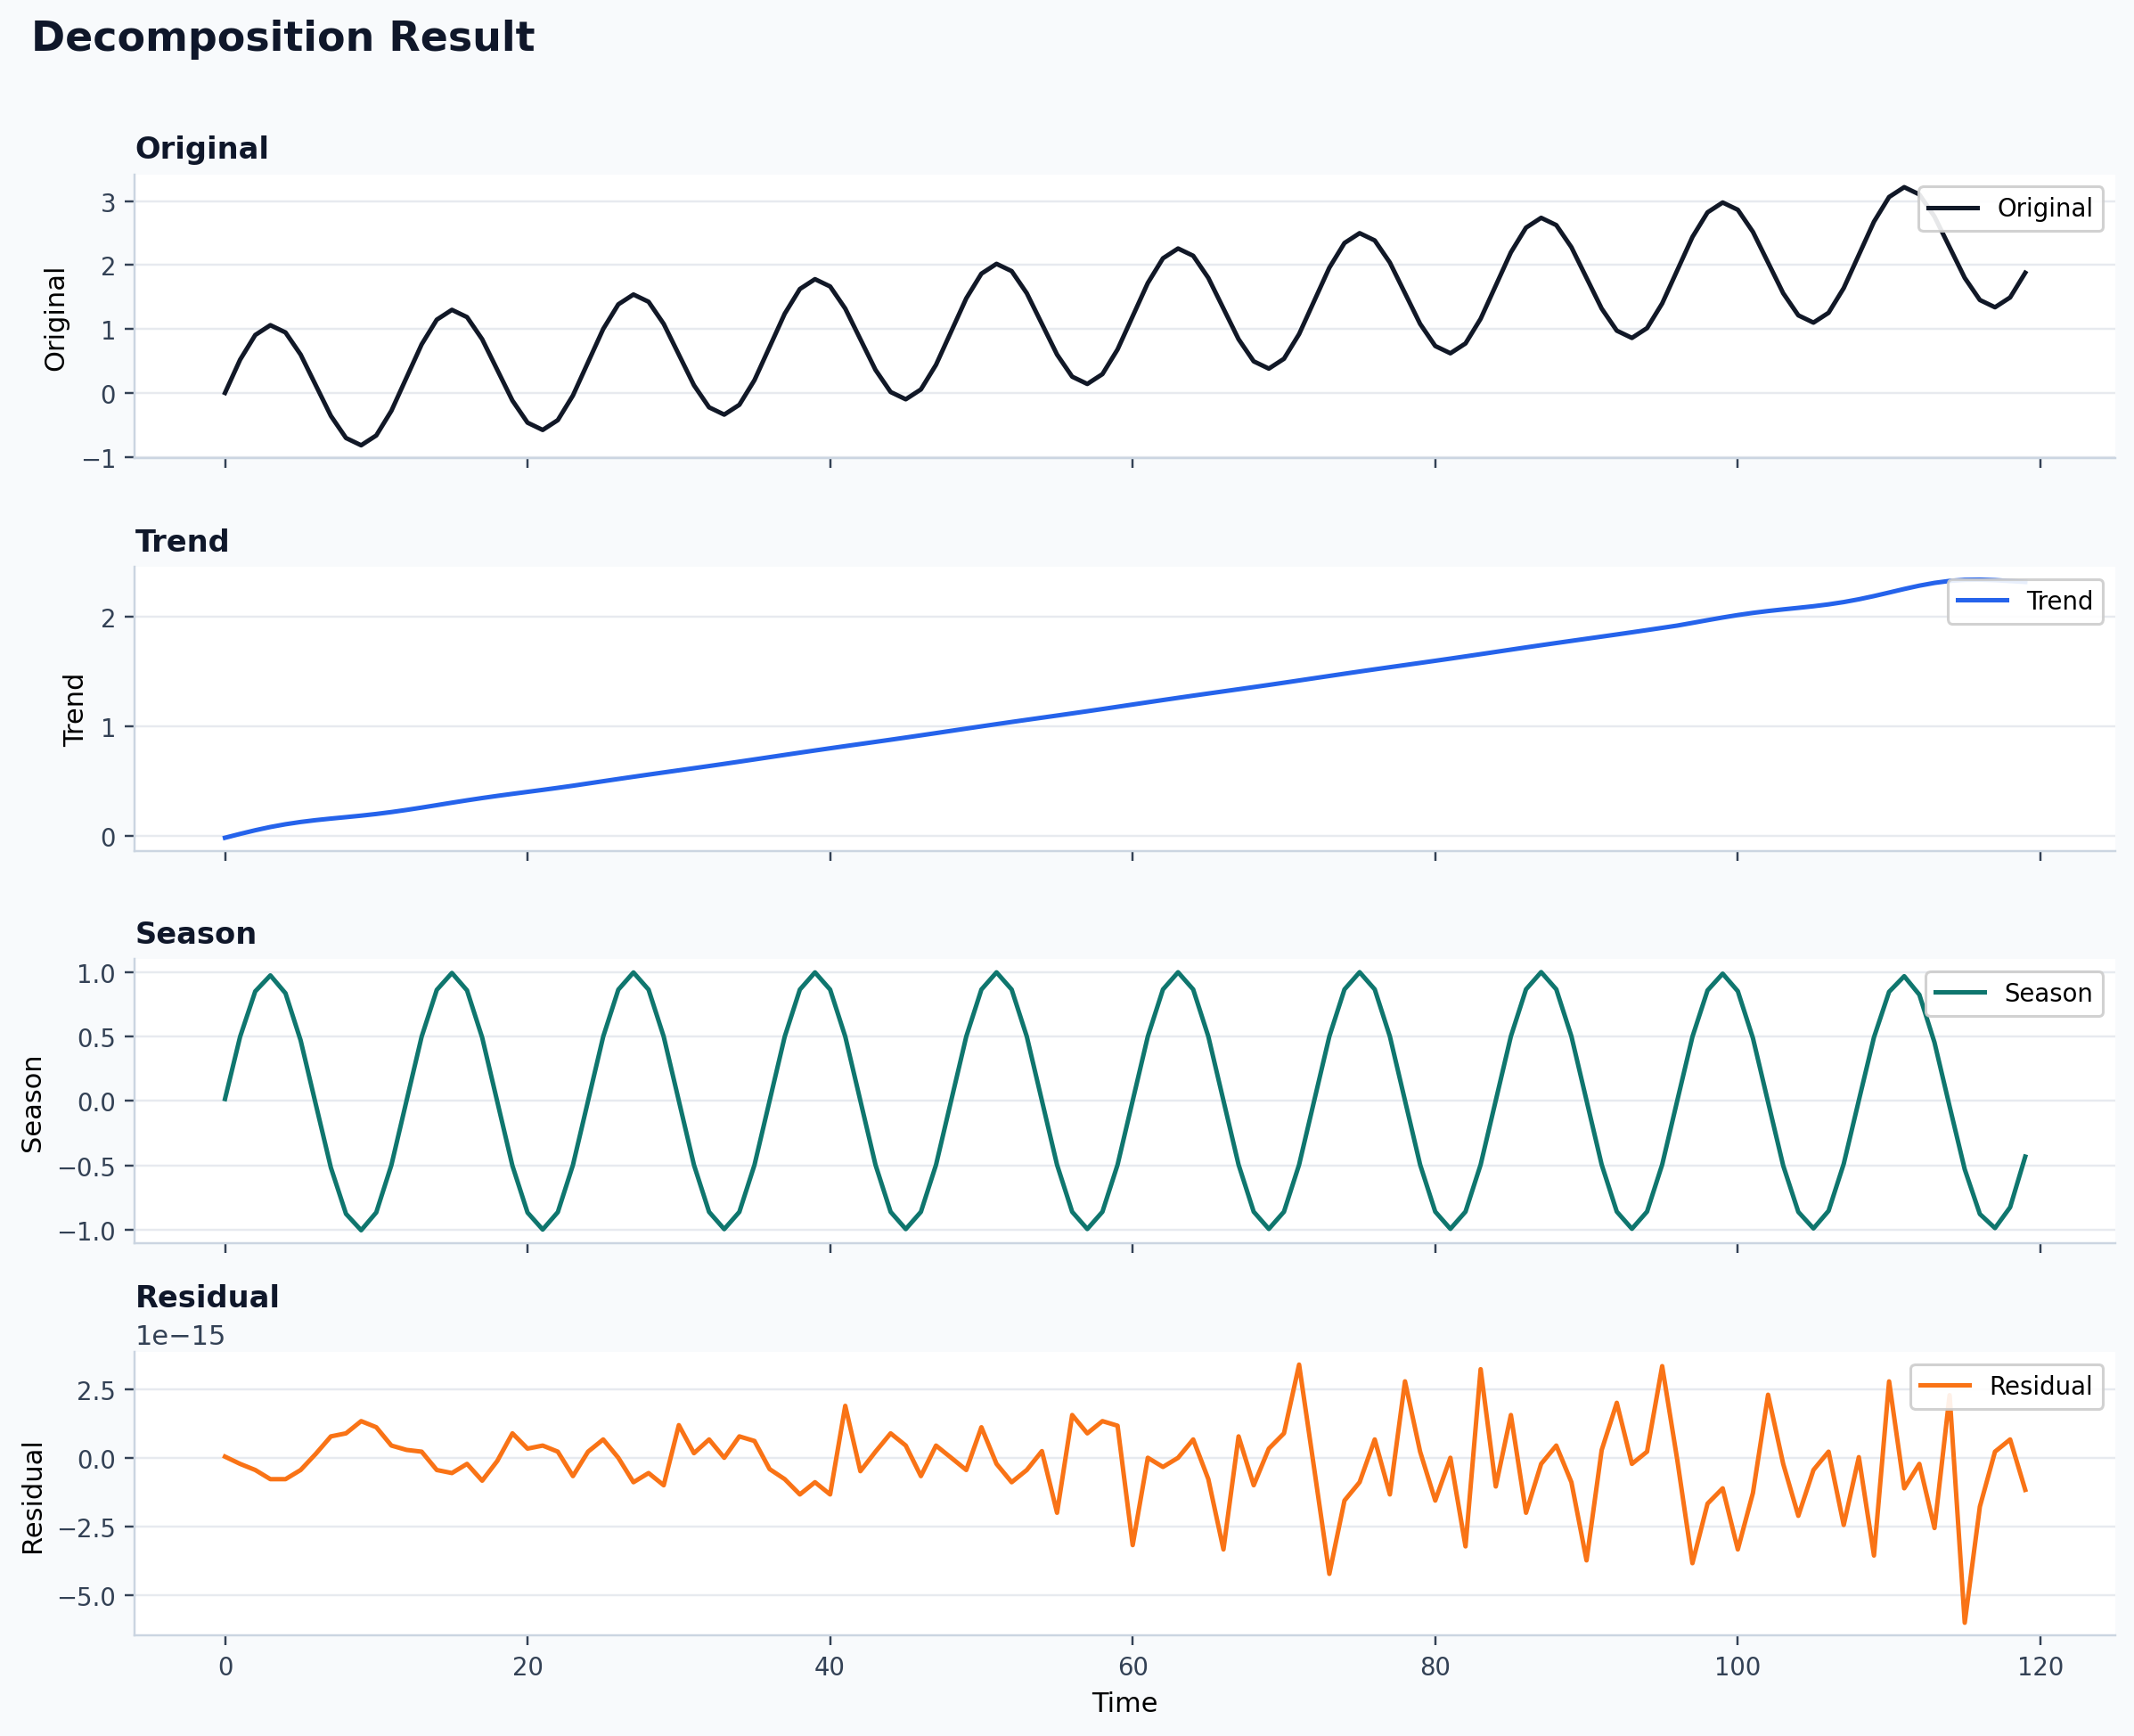
Python example: SSA
import numpy as np
from detime import DecompositionConfig, decompose

t = np.arange(120, dtype=float)
series = 0.02 * t + np.sin(2.0 * np.pi * t / 12.0)

result = decompose(
    series,
    DecompositionConfig(
        method="SSA",
        params={"window": 24, "rank": 6, "primary_period": 12},
    ),
)
Observed output from examples/univariate_quickstart.py on the current docs
build:
trend shape: (120,)
season shape: (120,)
residual shape: (120,)
backend: native
Published raw stdout:
Published method snapshot on the repo sample series
The current docs build also records a direct SSA versus STD snapshot on
examples/data/example_series.csv.
| Method | Backend | Trend std | Seasonal std | Residual RMS | Peak residual | Reconstruction error |
|---|---|---|---|---|---|---|
SSA |
native |
0.6917 | 0.7036 | 0.0000 | 0.0000 | 0.0000 |
STD |
native |
0.6893 | 0.6558 | 0.0000 | 0.0000 | 0.0000 |
Published experiment record:
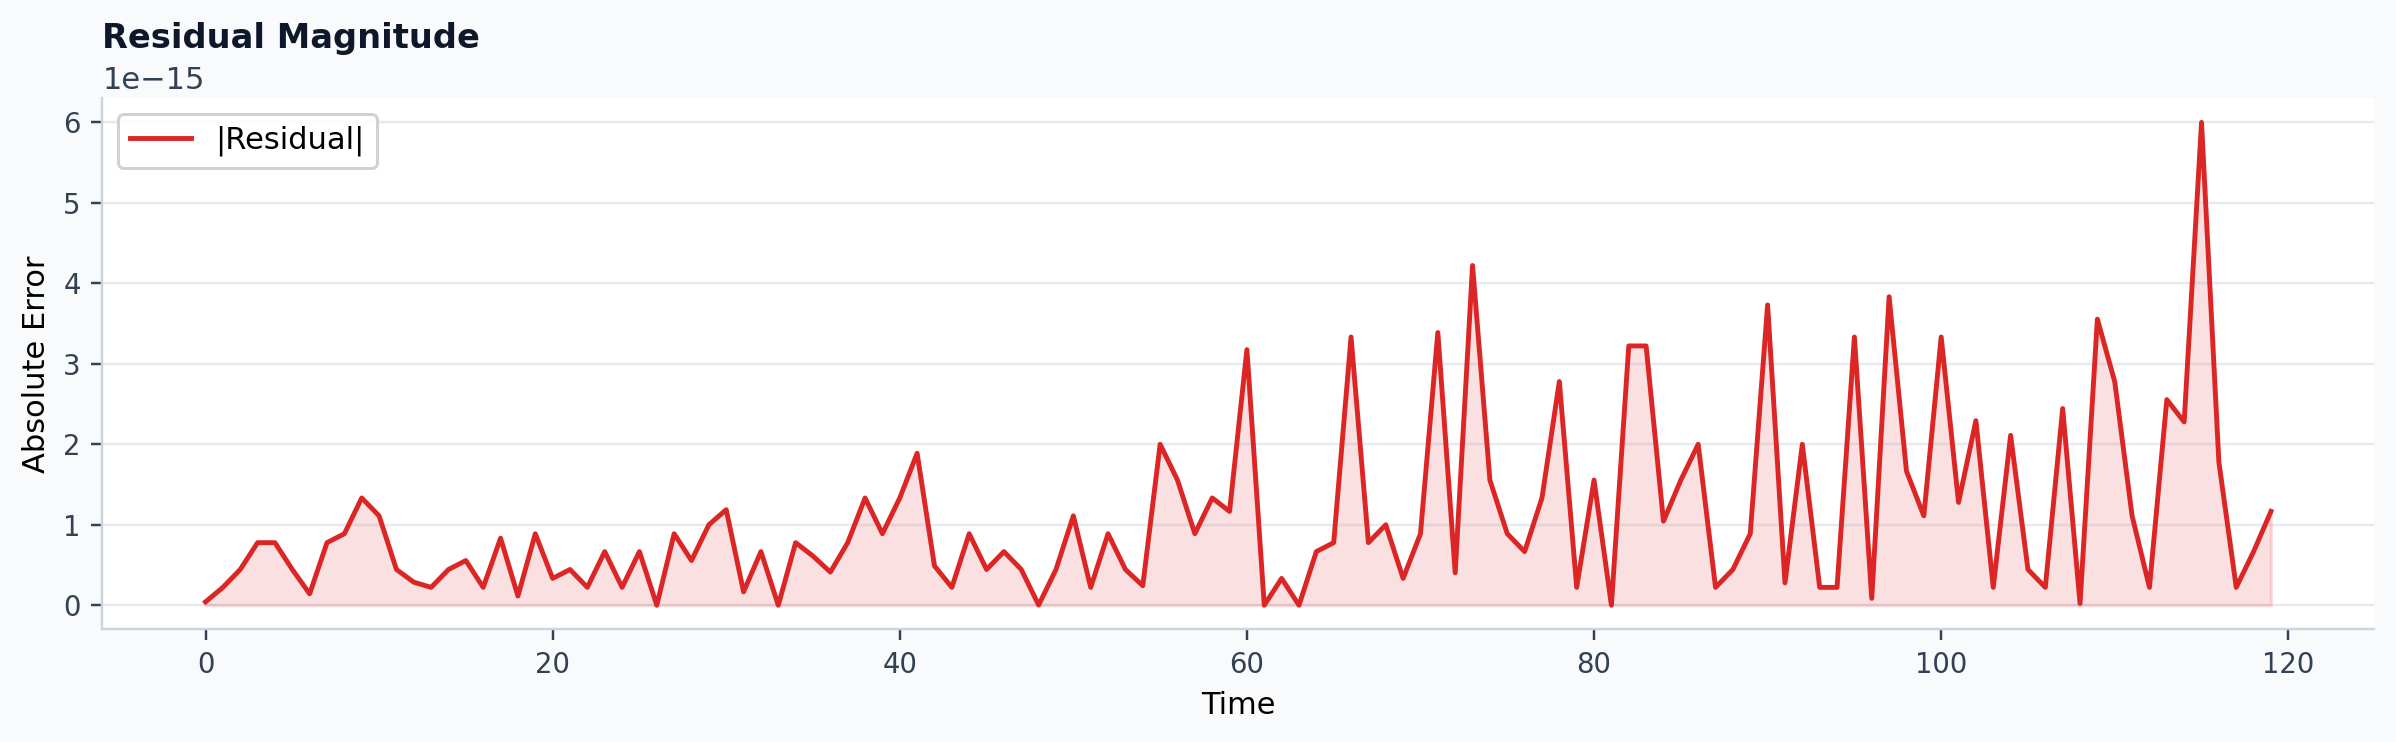
This sample series is intentionally smooth and periodic, so both methods reconstruct it almost perfectly. Use the visual walkthroughs below when you want a noisier signal that leaves a visible residual.
Saving output with the CLI
python -m detime run \
  --method SSA \
  --series examples/data/example_series.csv \
  --col value \
  --param window=24 \
  --param rank=6 \
  --param primary_period=12 \
  --out-dir out/ssa_run \
  --output-mode summary \
  --plot
Published CLI stdout from the current docs build:
Running SSA on examples/data/example_series.csv...
Done. Results saved to out/ssa_run
Published output files:
Published example outputs:
Where to go next
- Use Visual Univariate Walkthrough when you want one noisier signal with clearer residual structure.
- Use Visual Method Comparison when you want to compare
SSA,STD,STDR, andSTLon the same series before choosing a default.