Hot Trend Lab Overview
examples/notebooks/hot_trends/00_hot_trend_lab_overview.ipynb and includes markdown cells, code cells, stdout, tables, and captured figures from the committed notebook.
Executed Notebook
This notebook is the executable entry point for the Hot Trend Lab column. It reviews the source registry, the DeTime component contract, and the publication scoring logic.
Each case notebook fetches real public data at runtime and records the source, coverage window, and measurement limits.
from pathlib import Path
import os

import matplotlib.pyplot as plt
import numpy as np
import pandas as pd

from examples.hot_trends.data import (
    HotTrendDataError,
    append_real_snapshot,
    build_arxiv_monthly_counts,
    fetch_coingecko_market_chart,
    fetch_defillama_stablecoin_chains,
    fetch_github_repo_metadata,
    fetch_github_stargazers,
    fetch_huggingface_models,
    fetch_wikipedia_pageviews,
    source_audit_table,
)
from examples.hot_trends.decomposition import (
    component_summary,
    decompose_table,
    editorial_priority,
    residual_event_table,
)
from examples.hot_trends.scoring import article_publication_phrasing

pd.set_option("display.max_columns", 80)
pd.set_option("display.max_rows", 80)
plt.rcParams.update({"axes.grid": True})

CACHE_DIR = Path("examples/hot_trends/cache")
OUTPUT_DIR = Path("examples/hot_trends/outputs")
CACHE_DIR.mkdir(parents=True, exist_ok=True)
OUTPUT_DIR.mkdir(parents=True, exist_ok=True)

def save_table(df, name):
    path = OUTPUT_DIR / f"{name}.csv"
    df.to_csv(path, index=False)
    print(f"saved: {path.as_posix()}")
1. Source registry
The source registry is the evidence object for this column. It tells readers what is being measured and how to interpret each signal.
registry = pd.read_csv(Path("examples/hot_trends/reports/source_registry.csv"))
registry
| source | endpoint | notebooks | source_context | freshness | interpretation_scope | |
|---|---|---|---|---|---|---|
| 0 | arXiv API | https://export.arxiv.org/api/query | 01,02 | live public API | weekly/monthly | preprints are not peer-reviewed; cross-listing... |
| 1 | arXiv monthly submissions | https://arxiv.org/show_monthly_submissions | 00,01 | official public stats page | monthly | global totals are separate from category-level... |
| 2 | Hugging Face Hub API | https://huggingface.co/api/models | 03 | live public API; repeated snapshots support ti... | daily/weekly | downloads and likes are public adoption proxies |
| 3 | GitHub REST API | https://api.github.com/repos/{owner}/{repo}/st... | 04 | live public API; token recommended | weekly | stars are public repository-interest signals |
| 4 | Wikimedia Analytics API | https://wikimedia.org/api/rest_v1/metrics/page... | 05 | live public API | daily/weekly | pageviews reflect public attention during the ... |
| 5 | DeFiLlama stablecoin API | https://stablecoins.llama.fi/stablecoins?inclu... | 06 | live public API | daily/weekly | stablecoin endpoint schema should be checked d... |
| 6 | CoinGecko API | https://api.coingecko.com/api/v3/coins/{id}/ma... | 06 | live public API | per run | rate limits and plan limits apply |
| 7 | Yahoo Finance via yfinance | yfinance.download | 07 | live public market data via yfinance | per run | unofficial public wrapper; use licensed point-... |
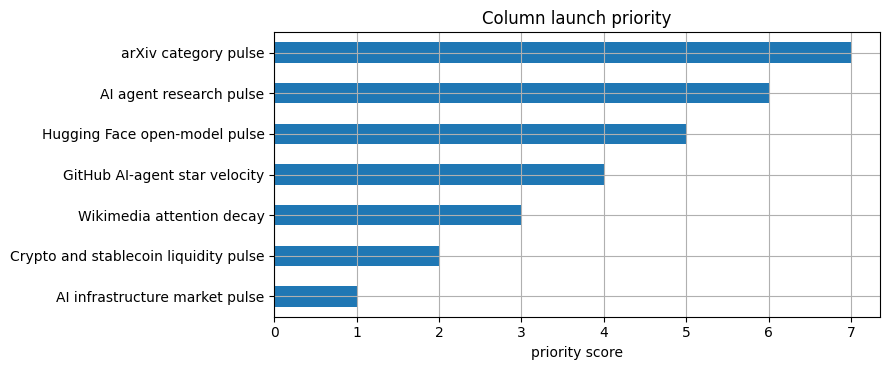
2. Column priority matrix
The strongest first wave is arXiv because it combines public data, academic relevance, high AI traffic, and a clean trend/cycle/residual story.
priority = pd.DataFrame([
    {"rank": 1, "case": "arXiv category pulse", "why_it_can_pop": "AI paper growth is controversial, measurable, and easy to refresh.", "rendered_page": "notebooks/01_arxiv_category_pulse/"},
    {"rank": 2, "case": "AI agent research pulse", "why_it_can_pop": "Agent and coding-agent papers move quickly and map to active product debates.", "rendered_page": "notebooks/02_arxiv_agent_research_pulse/"},
    {"rank": 3, "case": "Hugging Face open-model pulse", "why_it_can_pop": "Open-model releases create visible download and like snapshots.", "rendered_page": "notebooks/03_huggingface_open_model_pulse/"},
    {"rank": 4, "case": "GitHub AI-agent star velocity", "why_it_can_pop": "Developer attention is high-signal for tooling narratives.", "rendered_page": "notebooks/04_github_ai_agent_star_velocity/"},
    {"rank": 5, "case": "Wikimedia attention decay", "why_it_can_pop": "Pageviews turn public hype into a measurable time series.", "rendered_page": "notebooks/05_wikipedia_attention_hype_decay/"},
    {"rank": 6, "case": "Crypto and stablecoin liquidity pulse", "why_it_can_pop": "Crypto liquidity moves fast and has strong public attention.", "rendered_page": "notebooks/06_crypto_stablecoin_liquidity_pulse/"},
    {"rank": 7, "case": "AI infrastructure market pulse", "why_it_can_pop": "AI infrastructure remains a major market narrative.", "rendered_page": "notebooks/07_ai_infrastructure_market_pulse/"},
])
priority
| rank | case | why_it_can_pop | rendered_page | |
|---|---|---|---|---|
| 0 | 1 | arXiv category pulse | AI paper growth is controversial, measurable, ... | notebooks/01_arxiv_category_pulse/ |
| 1 | 2 | AI agent research pulse | Agent and coding-agent papers move quickly and... | notebooks/02_arxiv_agent_research_pulse/ |
| 2 | 3 | Hugging Face open-model pulse | Open-model releases create visible download an... | notebooks/03_huggingface_open_model_pulse/ |
| 3 | 4 | GitHub AI-agent star velocity | Developer attention is high-signal for tooling... | notebooks/04_github_ai_agent_star_velocity/ |
| 4 | 5 | Wikimedia attention decay | Pageviews turn public hype into a measurable t... | notebooks/05_wikipedia_attention_hype_decay/ |
| 5 | 6 | Crypto and stablecoin liquidity pulse | Crypto liquidity moves fast and has strong pub... | notebooks/06_crypto_stablecoin_liquidity_pulse/ |
| 6 | 7 | AI infrastructure market pulse | AI infrastructure remains a major market narra... | notebooks/07_ai_infrastructure_market_pulse/ |
Visualization: column priority score
The priority bar chart makes the editorial launch order explicit.
priority_plot = priority.assign(priority_score=len(priority) + 1 - priority["rank"]).sort_values("priority_score")
ax = priority_plot.plot(kind="barh", x="case", y="priority_score", figsize=(9, 3.8), legend=False, title="Column launch priority")
ax.set_xlabel("priority score")
ax.set_ylabel("")
plt.tight_layout()
plt.show()
3. DeTime output contract
Each notebook exports the same table types: source audit, component summary, residual events, and publication phrasing.
output_contract = pd.DataFrame([
    {"table": "source_audit", "purpose": "proves the table came from a real source and records coverage"},
    {"table": "component_summary", "purpose": "trend slope, cycle strength, residual shock score"},
    {"table": "residual_events", "purpose": "event-like deviations for article hooks"},
    {"table": "publication_phrasing", "purpose": "evidence-based publication phrasing"},
])
output_contract
| table | purpose | |
|---|---|---|
| 0 | source_audit | proves the table came from a real source and r... |
| 1 | component_summary | trend slope, cycle strength, residual shock score |
| 2 | residual_events | event-like deviations for article hooks |
| 3 | publication_phrasing | evidence-based publication phrasing |
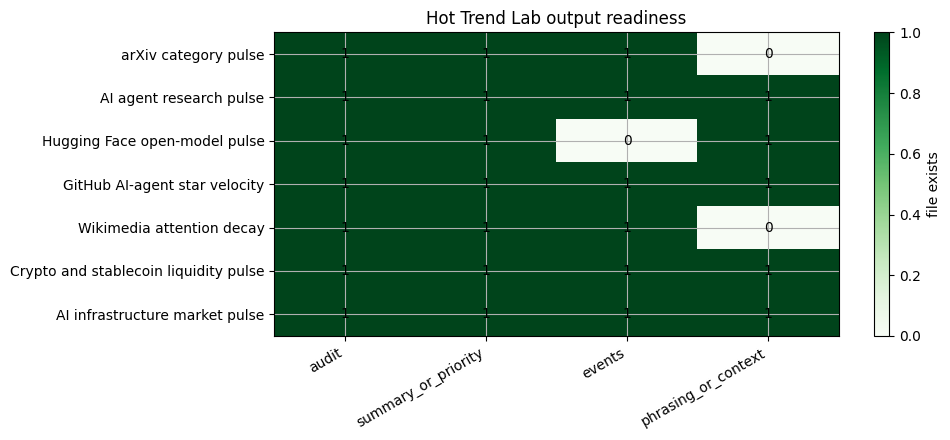
Visualization: output readiness matrix
The readiness matrix checks whether each case has produced its key real-data output files.
expected_outputs = pd.DataFrame([
    {"case": "arXiv category pulse", "audit": "01_arxiv_category_audit.csv", "summary_or_priority": "01_arxiv_category_priority.csv", "events": "01_arxiv_category_residual_events.csv", "phrasing_or_context": "01_arxiv_category_publication_phrasing.csv"},
    {"case": "AI agent research pulse", "audit": "02_arxiv_agent_topic_audit.csv", "summary_or_priority": "02_arxiv_agent_topic_priority.csv", "events": "02_arxiv_agent_topic_residual_events.csv", "phrasing_or_context": "02_arxiv_agent_article_outline.csv"},
    {"case": "Hugging Face open-model pulse", "audit": "03_hf_snapshot_audit.csv", "summary_or_priority": "03_hf_decomposition_or_collection_status.csv", "events": "03_hf_residual_events.csv", "phrasing_or_context": "03_hf_publication_phrasing.csv"},
    {"case": "GitHub AI-agent star velocity", "audit": "04_github_stargazer_coverage.csv", "summary_or_priority": "04_github_decomposition_or_collection_status.csv", "events": "04_github_residual_events.csv", "phrasing_or_context": "04_github_publication_phrasing.csv"},
    {"case": "Wikimedia attention decay", "audit": "05_wikipedia_attention_audit.csv", "summary_or_priority": "05_wikipedia_attention_summary.csv", "events": "05_wikipedia_attention_events.csv", "phrasing_or_context": "05_wikipedia_publication_phrasing.csv"},
    {"case": "Crypto and stablecoin liquidity pulse", "audit": "06_crypto_price_audit.csv", "summary_or_priority": "06_crypto_price_summary.csv", "events": "06_crypto_price_residual_events.csv", "phrasing_or_context": "06_defillama_stablecoin_context.csv"},
    {"case": "AI infrastructure market pulse", "audit": "07_ai_infra_market_audit.csv", "summary_or_priority": "07_ai_infra_component_summary.csv", "events": "07_ai_infra_residual_events.csv", "phrasing_or_context": "07_ai_infra_publication_phrasing.csv"},
])
availability = expected_outputs.set_index("case").apply(lambda col: col.map(lambda filename: (OUTPUT_DIR / filename).exists())).astype(int)
fig, ax = plt.subplots(figsize=(10, 4.5))
im = ax.imshow(availability.to_numpy(), cmap="Greens", vmin=0, vmax=1, aspect="auto")
ax.set_xticks(range(len(availability.columns)))
ax.set_xticklabels(availability.columns, rotation=30, ha="right")
ax.set_yticks(range(len(availability.index)))
ax.set_yticklabels(availability.index)
for y in range(availability.shape[0]):
    for x in range(availability.shape[1]):
        ax.text(x, y, str(int(availability.iloc[y, x])), ha="center", va="center", color="black")
ax.set_title("Hot Trend Lab output readiness")
fig.colorbar(im, ax=ax, label="file exists")
plt.tight_layout()
plt.show()
4. Language phrasing
article_publication_phrasing()
| draft_claim | evidence_based_phrasing | |
|---|---|---|
| 0 | This trend predicts the next price move. | This trend summarizes the observed public seri... |
| 1 | This model is better because it has more downl... | Downloads are a public adoption proxy interpre... |
| 2 | This repo is winning because stars are rising. | Star velocity measures developer attention for... |
| 3 | This pageview spike shows the topic matters most. | Pageviews measure public attention during the ... |
| 4 | This residual is a buy signal. | This residual marks an event-like deviation fr... |
save_table(registry, "00_source_registry")
save_table(priority, "00_hot_trend_priority")
save_table(output_contract, "00_output_contract")
save_table(article_publication_phrasing(), "00_publication_phrasing")
saved: examples/hot_trends/outputs/00_source_registry.csv
saved: examples/hot_trends/outputs/00_hot_trend_priority.csv
saved: examples/hot_trends/outputs/00_output_contract.csv
saved: examples/hot_trends/outputs/00_publication_phrasing.csv