Multivariate workflows
Supported multivariate methods
Current multivariate-capable methods are:
MSSAMVMDMEMD
Channelwise methods that also accept 2D (T, C) input:
STDSTDR
Python example: MSSA
import numpy as np
from detime import DecompositionConfig, decompose

t = np.arange(96, dtype=float)
series = np.column_stack(
    [
        0.03 * t + np.sin(2.0 * np.pi * t / 12.0),
        -0.01 * t + 0.6 * np.sin(2.0 * np.pi * t / 12.0 + 0.4),
    ]
)

result = decompose(
    series,
    DecompositionConfig(
        method="MSSA",
        params={"window": 24, "rank": 8, "primary_period": 12},
        channel_names=["x0", "x1"],
    ),
)
Observed output from examples/multivariate_mssa.py on the current docs build:
trend shape: (96, 2)
modes shape: (8, 96, 2)
backend: python
Published raw stdout:
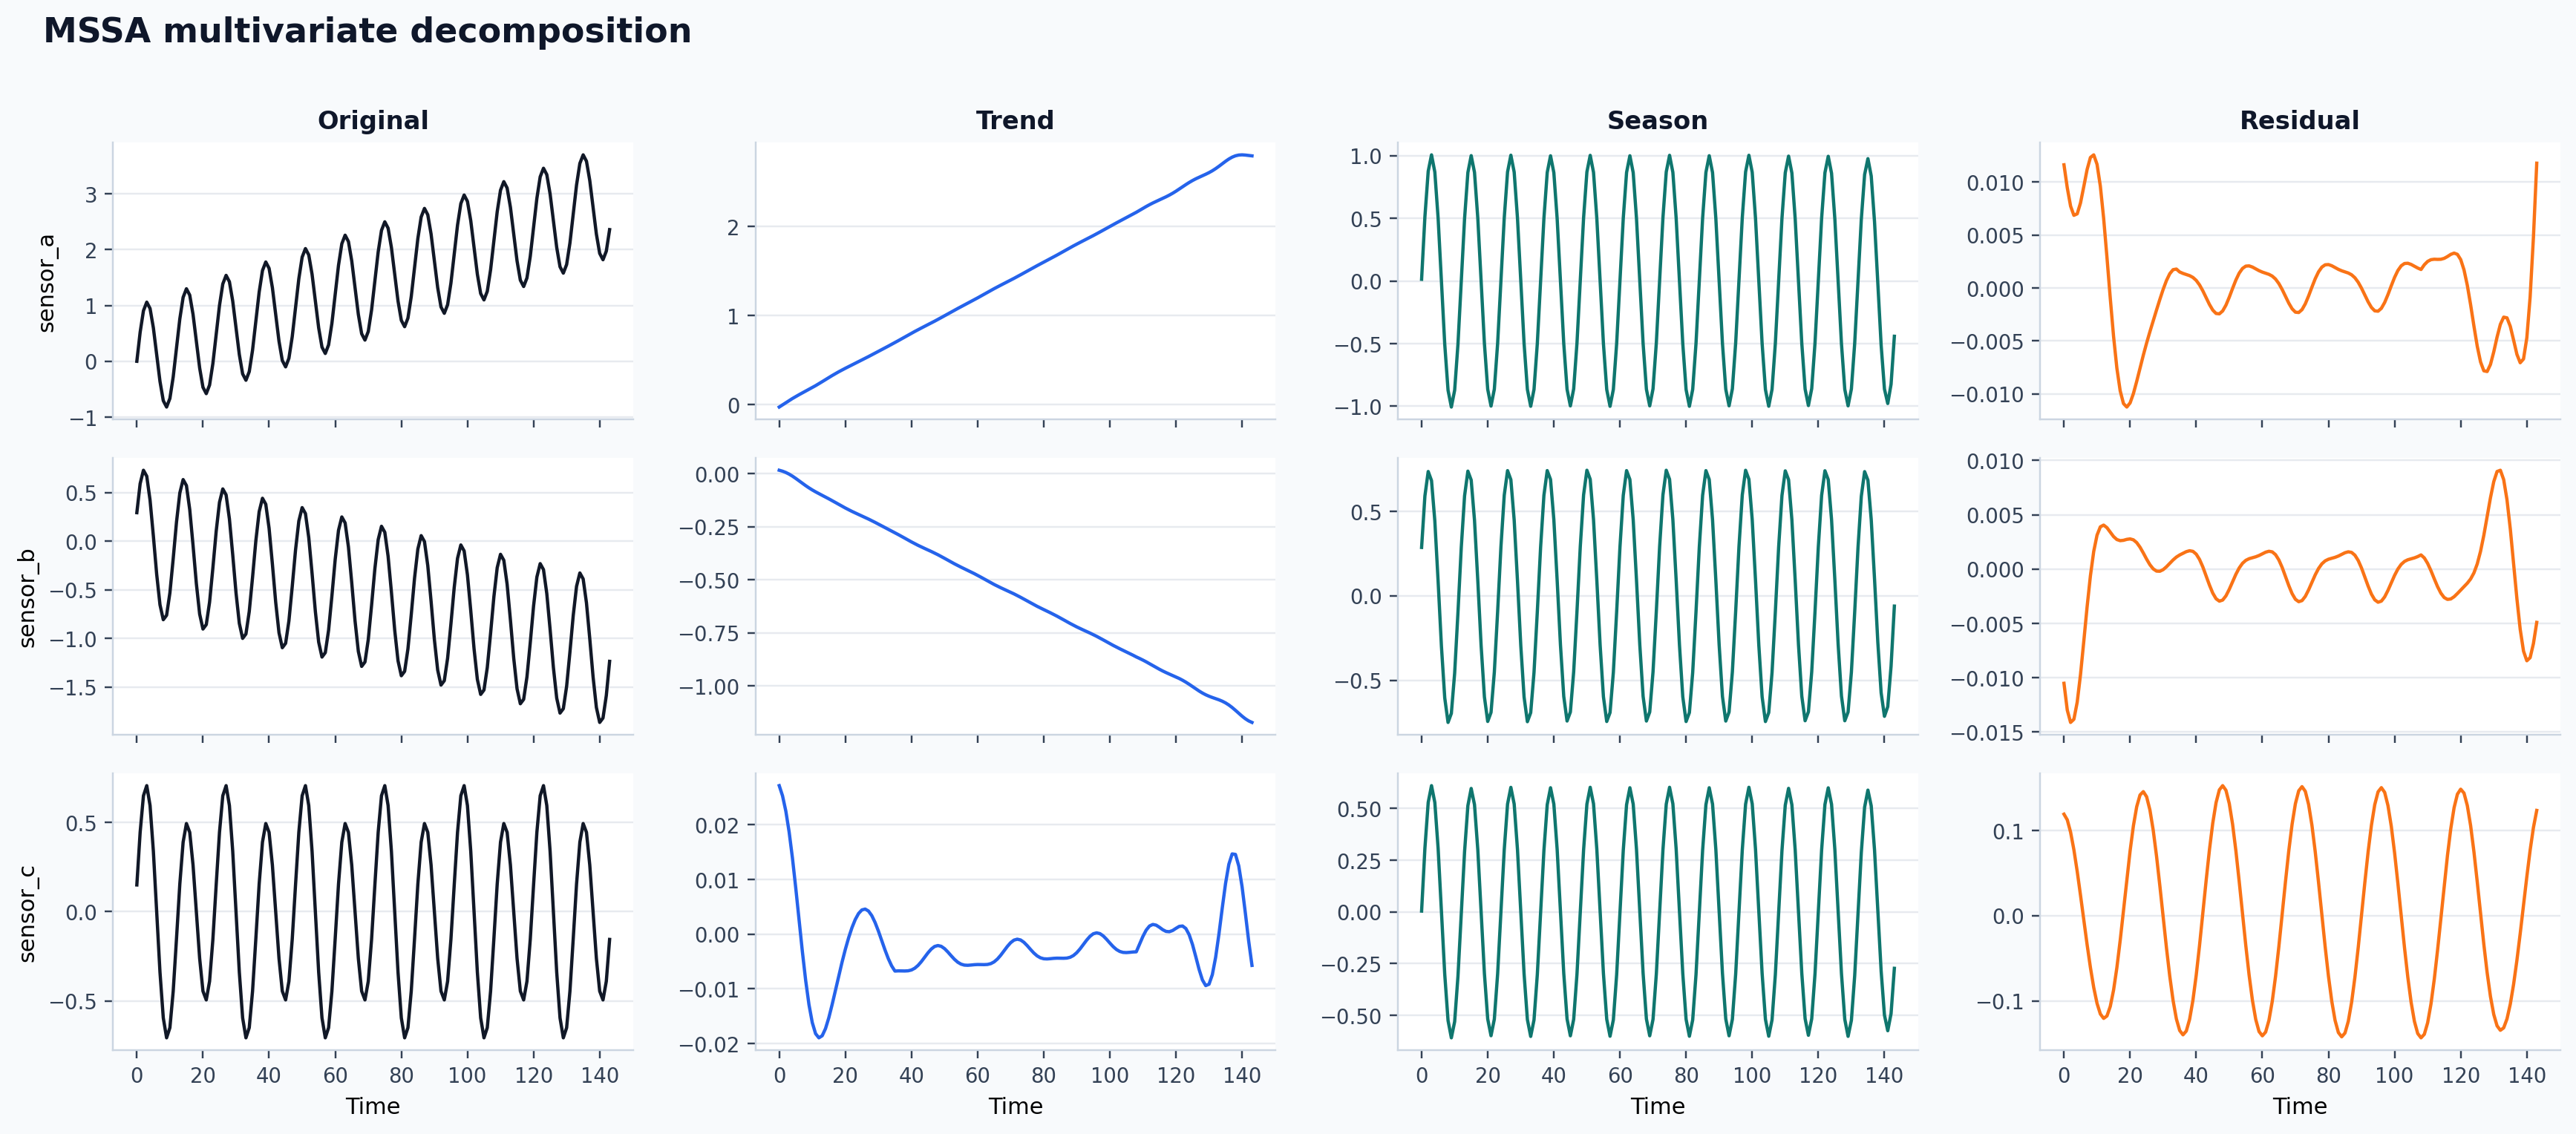
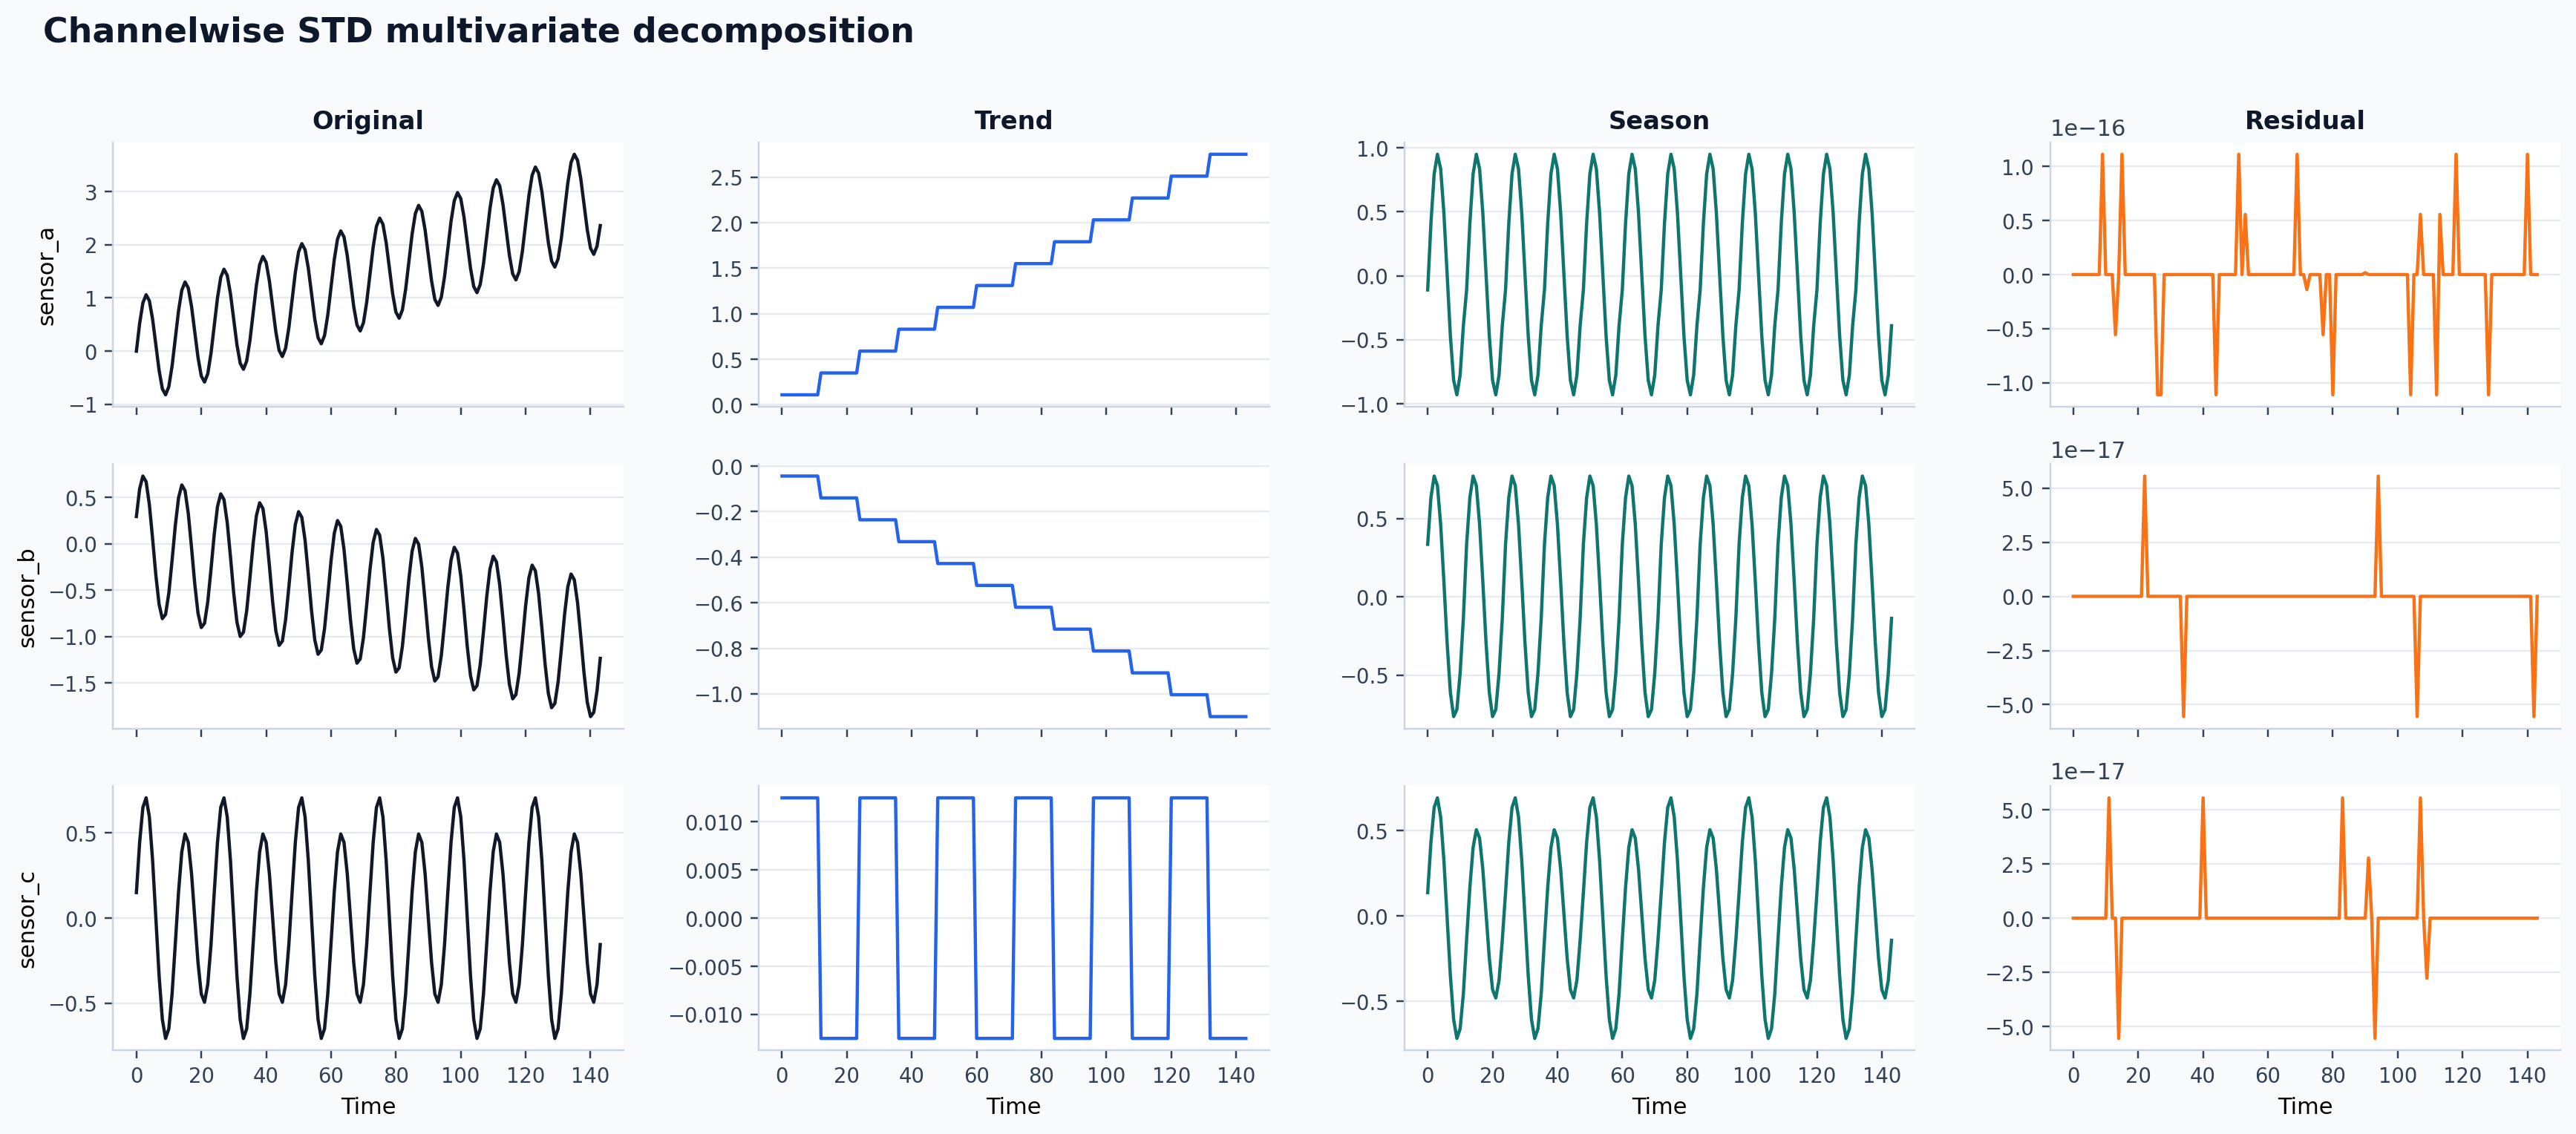
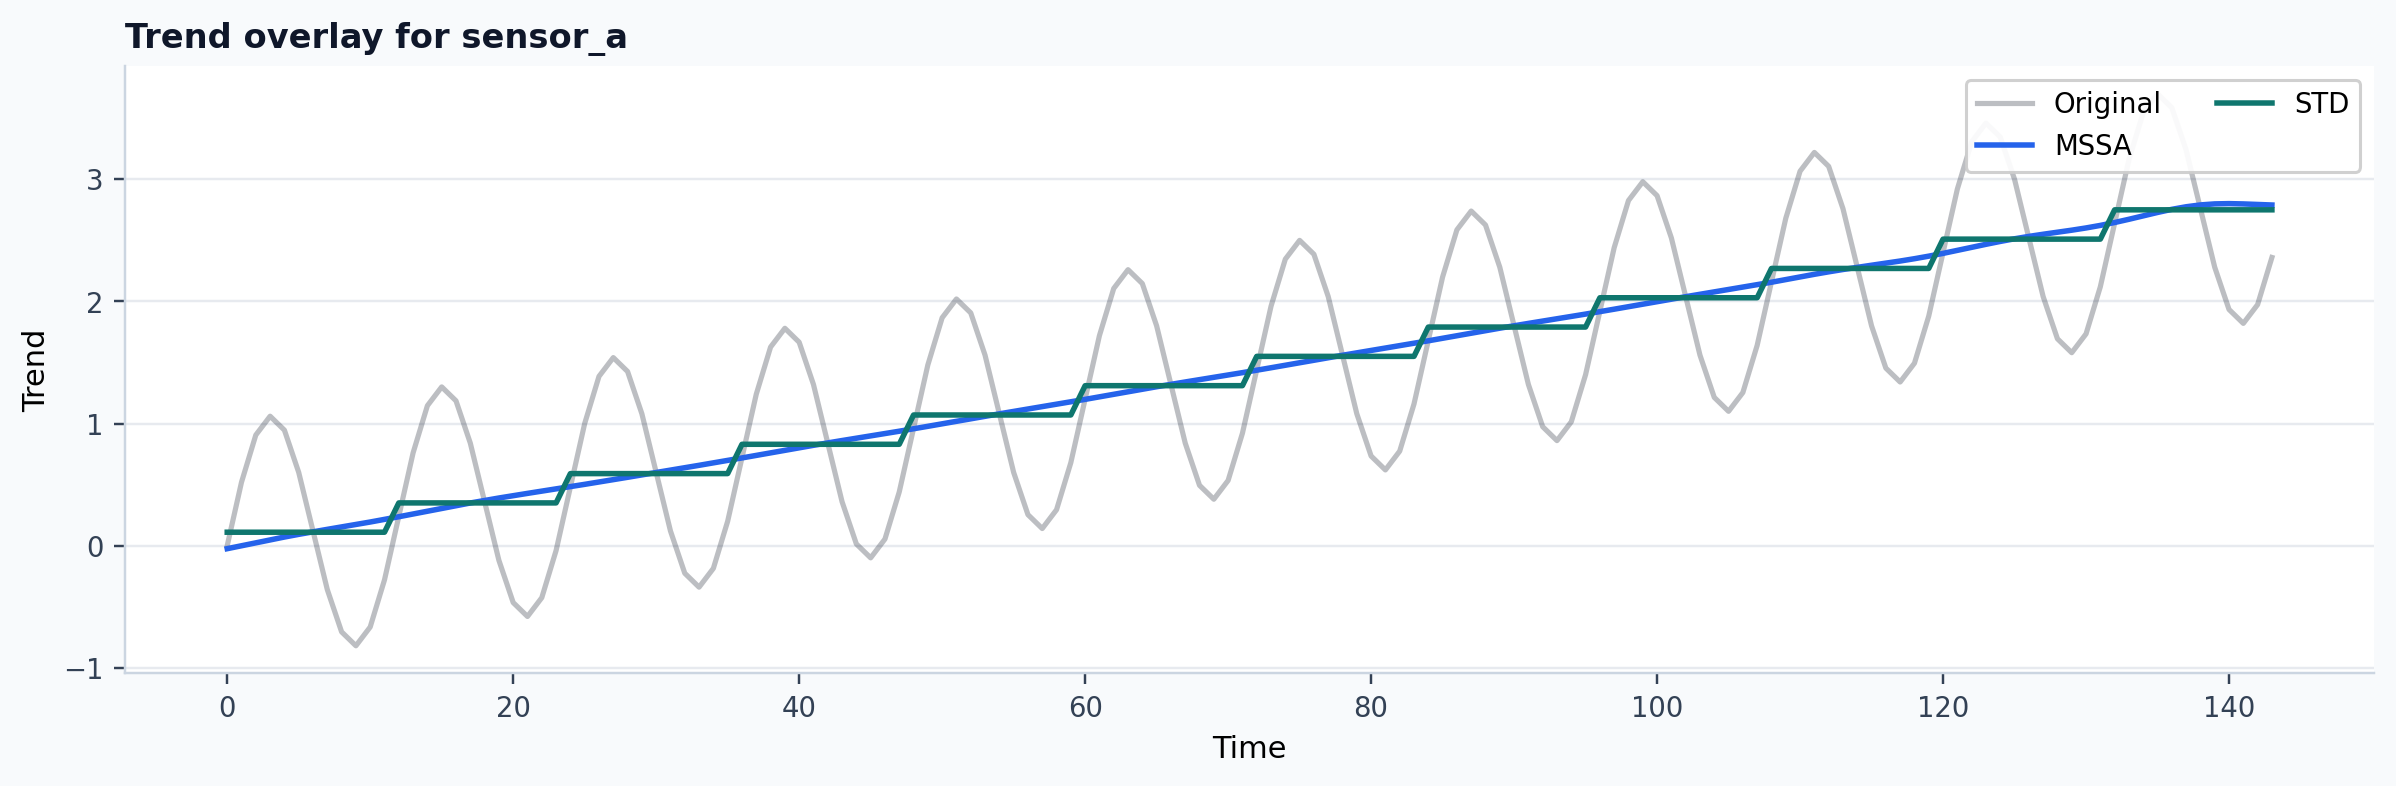
Published multivariate comparison
The current docs build also publishes a joint MSSA versus channelwise STD
walkthrough on a three-channel synthetic panel.
| Channel | MSSA backend | STD backend | MSSA residual RMS | STD residual RMS | Mean abs trend gap |
|---|---|---|---|---|---|
sensor_a |
python |
native |
0.0047 | 0.0000 | 0.0590 |
sensor_b |
python |
native |
0.0038 | 0.0000 | 0.0260 |
sensor_c |
python |
native |
0.0999 | 0.0000 | 0.0128 |
Published experiment record:
Published example outputs:
CLI
python -m detime run \
  --method MSSA \
  --series examples/data/example_multivariate.csv \
  --cols x0,x1 \
  --param window=24 \
  --param rank=8 \
  --param primary_period=12 \
  --out-dir out/mssa_run \
  --output-mode summary
Published CLI stdout from the current docs build:
Running MSSA on examples/data/example_multivariate.csv...
Done. Results saved to out/mssa_run
Published output files:
Representative summary excerpt from the current build:
{
  "mode": "summary",
  "trend": { "shape": [120, 2] },
  "season": { "shape": [120, 2] },
  "components": {
    "modes": { "shape": [8, 120, 2] }
  },
  "meta": {
    "backend_used": "python",
    "channel_names": ["x0", "x1"]
  }
}
When output-mode is full, multivariate results are written as wide CSV for
2D outputs plus .npz archives for 3D components. In the published docs
build, summary mode is used to keep the artifact small and easy to inspect.
Where to go next
- Use Visual Multivariate Walkthrough for the full side-by-side interpretation of the figures above.
- Use CLI and Profiling when you want the exact batch, profile, schema, and metadata-shortlist commands that operate on repo-shipped files.