arXiv Agent and Coding-Agent Research Pulse
Executed tutorial notebook. This page is generated from
examples/notebooks/hot_trends/02_arxiv_agent_research_pulse.ipynb and includes markdown cells, code cells, stdout, tables, and captured figures from the committed notebook.
Executed Notebook
This notebook tracks query-based research topics on arXiv. It is designed for fast-moving themes where category alone is too broad.
Good first topics:
- AI agents;
- coding agents;
- tool use;
- retrieval-augmented generation;
- mechanistic interpretability;
- AI for science.
Data source: arXiv API.
In [1]
from pathlib import Path
import os

import matplotlib.pyplot as plt
import numpy as np
import pandas as pd

from examples.hot_trends.data import (
    HotTrendDataError,
    append_real_snapshot,
    build_arxiv_monthly_counts,
    fetch_coingecko_market_chart,
    fetch_defillama_stablecoin_chains,
    fetch_github_repo_metadata,
    fetch_github_stargazers,
    fetch_huggingface_models,
    fetch_wikipedia_pageviews,
    source_audit_table,
)
from examples.hot_trends.decomposition import (
    component_summary,
    decompose_table,
    editorial_priority,
    residual_event_table,
)
from examples.hot_trends.scoring import article_publication_phrasing

pd.set_option("display.max_columns", 80)
pd.set_option("display.max_rows", 80)
plt.rcParams.update({"axes.grid": True})

CACHE_DIR = Path("examples/hot_trends/cache")
OUTPUT_DIR = Path("examples/hot_trends/outputs")
CACHE_DIR.mkdir(parents=True, exist_ok=True)
OUTPUT_DIR.mkdir(parents=True, exist_ok=True)

def save_table(df, name):
    path = OUTPUT_DIR / f"{name}.csv"
    df.to_csv(path, index=False)
    print(f"saved: {path.as_posix()}")
1. Define query pulses
The queries below are deliberately explicit. Adjust them when the arXiv API parser or field syntax requires a stricter expression.
In [2]
topic_queries = {
    "ai_agent": 'all:"AI agent" OR all:"autonomous agent"',
    "coding_agent": 'all:"coding agent" OR all:"code agent" OR all:"program repair"',
    "tool_use": 'all:"tool use" OR all:"function calling"',
    "rag": 'all:"retrieval augmented generation" OR all:"RAG"',
    "mechanistic_interpretability": 'all:"mechanistic interpretability"',
    "ai_for_science": 'all:"AI for science" OR all:"scientific discovery"',
}
pd.DataFrame([{"topic": k, "query": v} for k, v in topic_queries.items()])
text/html
| topic | query | |
|---|---|---|
| 0 | ai_agent | all:"AI agent" OR all:"autonomous agent" |
| 1 | coding_agent | all:"coding agent" OR all:"code agent" OR all:... |
| 2 | tool_use | all:"tool use" OR all:"function calling" |
| 3 | rag | all:"retrieval augmented generation" OR all:"RAG" |
| 4 | mechanistic_interpretability | all:"mechanistic interpretability" |
| 5 | ai_for_science | all:"AI for science" OR all:"scientific discov... |
2. Fetch monthly topic counts
In [3]
START_MONTH = "2025-01-01"
END_MONTH = "2026-05-01"
SLEEP_SECONDS = 3.0

cache_path = CACHE_DIR / f"arxiv_agent_topic_counts_{START_MONTH}_{END_MONTH}.csv"
if cache_path.exists():
    counts = pd.read_csv(cache_path, parse_dates=["month"])
else:
    counts = build_arxiv_monthly_counts(topic_queries, start_month=START_MONTH, end_month=END_MONTH, sleep_seconds=SLEEP_SECONDS)
    counts.to_csv(cache_path, index=False)
counts.head(12)
text/html
| month | series | query | count | source | access_date | data_quality | |
|---|---|---|---|---|---|---|---|
| 0 | 2025-01-01 | ai_agent | all:"AI agent" OR all:"autonomous agent" | 65 | arXiv API | 2026-05-22 | public_api_snapshot |
| 1 | 2025-02-01 | ai_agent | all:"AI agent" OR all:"autonomous agent" | 112 | arXiv API | 2026-05-22 | public_api_snapshot |
| 2 | 2025-03-01 | ai_agent | all:"AI agent" OR all:"autonomous agent" | 91 | arXiv API | 2026-05-22 | public_api_snapshot |
| 3 | 2025-04-01 | ai_agent | all:"AI agent" OR all:"autonomous agent" | 115 | arXiv API | 2026-05-22 | public_api_snapshot |
| 4 | 2025-05-01 | ai_agent | all:"AI agent" OR all:"autonomous agent" | 173 | arXiv API | 2026-05-22 | public_api_snapshot |
| 5 | 2025-06-01 | ai_agent | all:"AI agent" OR all:"autonomous agent" | 150 | arXiv API | 2026-05-22 | public_api_snapshot |
| 6 | 2025-07-01 | ai_agent | all:"AI agent" OR all:"autonomous agent" | 131 | arXiv API | 2026-05-22 | public_api_snapshot |
| 7 | 2025-08-01 | ai_agent | all:"AI agent" OR all:"autonomous agent" | 163 | arXiv API | 2026-05-22 | public_api_snapshot |
| 8 | 2025-09-01 | ai_agent | all:"AI agent" OR all:"autonomous agent" | 158 | arXiv API | 2026-05-22 | public_api_snapshot |
| 9 | 2025-10-01 | ai_agent | all:"AI agent" OR all:"autonomous agent" | 206 | arXiv API | 2026-05-22 | public_api_snapshot |
| 10 | 2025-11-01 | ai_agent | all:"AI agent" OR all:"autonomous agent" | 162 | arXiv API | 2026-05-22 | public_api_snapshot |
| 11 | 2025-12-01 | ai_agent | all:"AI agent" OR all:"autonomous agent" | 172 | arXiv API | 2026-05-22 | public_api_snapshot |
3. Source audit
In [4]
audit = source_audit_table(counts, value_col="count", entity_col="series", time_col="month")
audit
text/html
| series | first_timestamp | last_timestamp | observations | missing_ratio | min_value | max_value | |
|---|---|---|---|---|---|---|---|
| 0 | ai_agent | 2025-01-01 00:00:00 | 2026-05-01 00:00:00 | 17 | 0.0 | 65.0 | 365.0 |
| 1 | ai_for_science | 2025-01-01 00:00:00 | 2026-05-01 00:00:00 | 17 | 0.0 | 21.0 | 63.0 |
| 2 | coding_agent | 2025-01-01 00:00:00 | 2026-05-01 00:00:00 | 17 | 0.0 | 8.0 | 118.0 |
| 3 | mechanistic_interpretability | 2025-01-01 00:00:00 | 2026-05-01 00:00:00 | 17 | 0.0 | 9.0 | 62.0 |
| 4 | rag | 2025-01-01 00:00:00 | 2026-05-01 00:00:00 | 17 | 0.0 | 154.0 | 336.0 |
| 5 | tool_use | 2025-01-01 00:00:00 | 2026-05-01 00:00:00 | 17 | 0.0 | 44.0 | 182.0 |
4. Decompose topic counts
In [5]
components = decompose_table(
    counts,
    entity_col="series",
    time_col="month",
    value_col="count",
    method="MA_BASELINE",
    period=12,
    trend_window=5,
    transform="log1p",
)
summary = component_summary(components, entity_col="series", time_col="month")
summary
text/html
| series | observations | first_timestamp | last_timestamp | trend_last | trend_slope_per_step | cycle_strength_proxy | residual_std | max_abs_residual_z | method | |
|---|---|---|---|---|---|---|---|---|---|---|
| 0 | ai_agent | 17 | 2025-01-01 00:00:00 | 2026-05-01 00:00:00 | 3.418475 | 0.059586 | -0.477001 | 0.503611 | 2.513110 | MA_BASELINE |
| 1 | ai_for_science | 17 | 2025-01-01 00:00:00 | 2026-05-01 00:00:00 | 2.489031 | 0.034805 | -1.013129 | 0.387375 | 14.858083 | MA_BASELINE |
| 2 | coding_agent | 17 | 2025-01-01 00:00:00 | 2026-05-01 00:00:00 | 2.792028 | 0.109713 | 0.697921 | 0.414089 | 6.951002 | MA_BASELINE |
| 3 | mechanistic_interpretability | 17 | 2025-01-01 00:00:00 | 2026-05-01 00:00:00 | 2.343744 | 0.047719 | 0.444266 | 0.318825 | 3.834405 | MA_BASELINE |
| 4 | rag | 17 | 2025-01-01 00:00:00 | 2026-05-01 00:00:00 | 3.389279 | 0.013511 | -6.572506 | 0.536696 | 6.078962 | MA_BASELINE |
| 5 | tool_use | 17 | 2025-01-01 00:00:00 | 2026-05-01 00:00:00 | 3.035190 | 0.064324 | -0.197874 | 0.467042 | 12.071310 | MA_BASELINE |
5. Editorial ranking
A topic with both positive trend slope and high residual shock deserves a timely post. A topic with trend but low residual is better for an evergreen explainer.
In [6]
priority = editorial_priority(summary, entity_col="series")
priority
text/html
| series | observations | first_timestamp | last_timestamp | trend_last | trend_slope_per_step | cycle_strength_proxy | residual_std | max_abs_residual_z | method | trend_slope_per_step_rank_pct | cycle_strength_proxy_rank_pct | max_abs_residual_z_rank_pct | editorial_priority_score | |
|---|---|---|---|---|---|---|---|---|---|---|---|---|---|---|
| 2 | coding_agent | 17 | 2025-01-01 00:00:00 | 2026-05-01 00:00:00 | 2.792028 | 0.109713 | 0.697921 | 0.414089 | 6.951002 | MA_BASELINE | 1.000000 | 1.000000 | 0.666667 | 0.850000 |
| 5 | tool_use | 17 | 2025-01-01 00:00:00 | 2026-05-01 00:00:00 | 3.035190 | 0.064324 | -0.197874 | 0.467042 | 12.071310 | MA_BASELINE | 0.833333 | 0.666667 | 0.833333 | 0.800000 |
| 1 | ai_for_science | 17 | 2025-01-01 00:00:00 | 2026-05-01 00:00:00 | 2.489031 | 0.034805 | -1.013129 | 0.387375 | 14.858083 | MA_BASELINE | 0.333333 | 0.333333 | 1.000000 | 0.633333 |
| 3 | mechanistic_interpretability | 17 | 2025-01-01 00:00:00 | 2026-05-01 00:00:00 | 2.343744 | 0.047719 | 0.444266 | 0.318825 | 3.834405 | MA_BASELINE | 0.500000 | 0.833333 | 0.333333 | 0.491667 |
| 0 | ai_agent | 17 | 2025-01-01 00:00:00 | 2026-05-01 00:00:00 | 3.418475 | 0.059586 | -0.477001 | 0.503611 | 2.513110 | MA_BASELINE | 0.666667 | 0.500000 | 0.166667 | 0.408333 |
| 4 | rag | 17 | 2025-01-01 00:00:00 | 2026-05-01 00:00:00 | 3.389279 | 0.013511 | -6.572506 | 0.536696 | 6.078962 | MA_BASELINE | 0.166667 | 0.166667 | 0.500000 | 0.316667 |
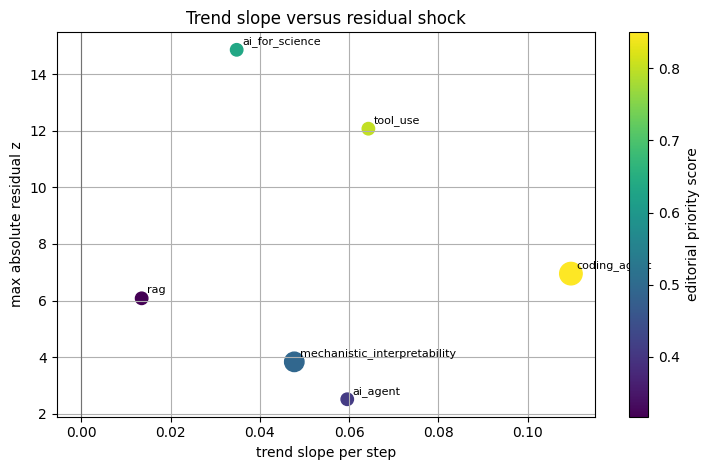
Visualization: AI-agent topic trend shock scatter
The scatter compares trend slope, shock magnitude, and cycle strength in the editorial priority table.
In [7]
scatter_frame = priority.dropna(subset=["trend_slope_per_step", "max_abs_residual_z"]).copy()
fig, ax = plt.subplots(figsize=(7.5, 4.8))
sizes = 80 + scatter_frame["cycle_strength_proxy"].fillna(0).clip(lower=0) * 260
sc = ax.scatter(
    scatter_frame["trend_slope_per_step"],
    scatter_frame["max_abs_residual_z"],
    s=sizes,
    c=scatter_frame["editorial_priority_score"],
    cmap="viridis",
)
for _, row in scatter_frame.head(8).iterrows():
    ax.annotate(str(row["series"]), (row["trend_slope_per_step"], row["max_abs_residual_z"]), fontsize=8, xytext=(4, 4), textcoords="offset points")
ax.axvline(0, color="0.45", linewidth=0.8)
ax.set_xlabel("trend slope per step")
ax.set_ylabel("max absolute residual z")
ax.set_title("Trend slope versus residual shock")
fig.colorbar(sc, ax=ax, label="editorial priority score")
plt.tight_layout()
plt.show()
image/png
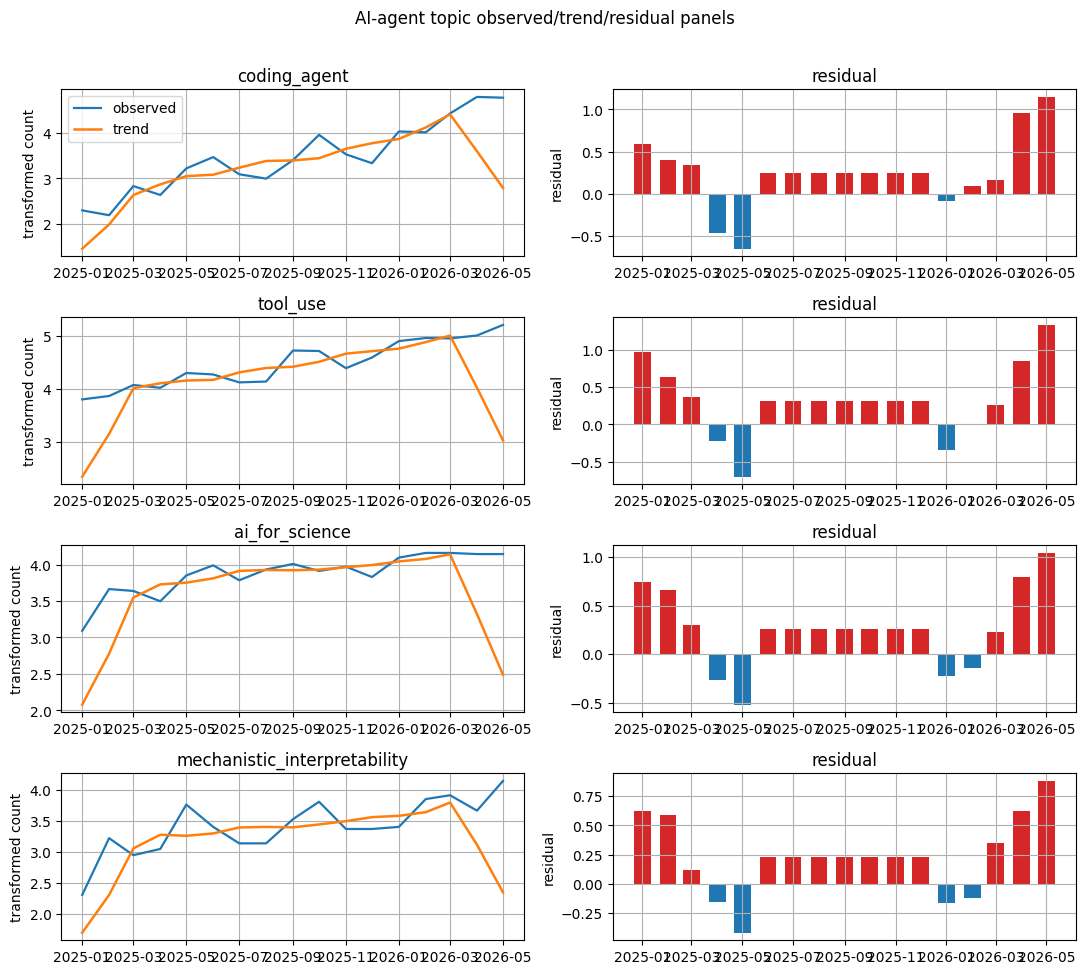
Visualization: AI-agent topic component panels
Observed and trend lines plus residual bars turn the component table into an inspectable trend narrative.
In [8]
top_entities = priority["series"].head(4).tolist()
fig, axes = plt.subplots(len(top_entities), 2, figsize=(11, max(3.0, 2.4 * len(top_entities))), squeeze=False)
for row, entity in enumerate(top_entities):
    panel = components.loc[components["series"].eq(entity)].sort_values("month").copy()
    panel["month"] = pd.to_datetime(panel["month"])
    axes[row, 0].plot(panel["month"], panel["observed"], label="observed", linewidth=1.6)
    axes[row, 0].plot(panel["month"], panel["trend"], label="trend", linewidth=1.8)
    axes[row, 0].set_title(str(entity))
    axes[row, 1].bar(panel["month"], panel["residual"], color=np.where(panel["residual"] >= 0, "tab:red", "tab:blue"), width=20)
    axes[row, 1].set_title("residual")
    axes[row, 0].set_ylabel("transformed count")
    axes[row, 1].set_ylabel("residual")
axes[0, 0].legend(loc="best")
plt.suptitle("AI-agent topic observed/trend/residual panels", y=1.01)
plt.tight_layout()
plt.show()
image/png
6. Event-like months
In [9]
events = residual_event_table(components, entity_col="series", time_col="month", top_n=20)
events
text/html
| month | series | observed | trend | season | residual | residual_z | abs_residual_z | method | |
|---|---|---|---|---|---|---|---|---|---|
| 0 | 2026-05-01 | ai_for_science | 4.143135 | 2.489031 | 0.614325 | 1.039779 | 14.858083 | 14.858083 | MA_BASELINE |
| 1 | 2025-05-01 | ai_for_science | 3.850148 | 3.751483 | 0.614325 | -0.515660 | -14.858083 | 14.858083 | MA_BASELINE |
| 2 | 2026-05-01 | tool_use | 5.209486 | 3.035190 | 0.841468 | 1.332828 | 12.071310 | 12.071310 | MA_BASELINE |
| 3 | 2025-05-01 | tool_use | 4.304065 | 4.162151 | 0.841468 | -0.699554 | -12.071310 | 12.071310 | MA_BASELINE |
| 4 | 2025-04-01 | ai_for_science | 3.496508 | 3.727357 | 0.033679 | -0.264529 | -10.060305 | 10.060305 | MA_BASELINE |
| 5 | 2026-04-01 | ai_for_science | 4.143135 | 3.320807 | 0.033679 | 0.788648 | 10.060305 | 10.060305 | MA_BASELINE |
| 6 | 2026-01-01 | ai_for_science | 4.094345 | 4.042209 | 0.270311 | -0.218175 | -9.174720 | 9.174720 | MA_BASELINE |
| 7 | 2025-01-01 | ai_for_science | 3.091042 | 2.078438 | 0.270311 | 0.742294 | 9.174720 | 9.174720 | MA_BASELINE |
| 8 | 2025-01-01 | tool_use | 3.806662 | 2.351080 | 0.482440 | 0.973142 | 7.798611 | 7.798611 | MA_BASELINE |
| 9 | 2026-01-01 | tool_use | 4.905275 | 4.762703 | 0.482440 | -0.339868 | -7.798611 | 7.798611 | MA_BASELINE |
| 10 | 2026-02-01 | ai_for_science | 4.158883 | 4.076777 | 0.221904 | -0.139799 | -7.677369 | 7.677369 | MA_BASELINE |
| 11 | 2025-02-01 | ai_for_science | 3.663562 | 2.777740 | 0.221904 | 0.663918 | 7.677369 | 7.677369 | MA_BASELINE |
| 12 | 2026-05-01 | coding_agent | 4.762174 | 2.792028 | 0.821414 | 1.148732 | 6.951002 | 6.951002 | MA_BASELINE |
| 13 | 2025-05-01 | coding_agent | 3.218876 | 3.049585 | 0.821414 | -0.652123 | -6.951002 | 6.951002 | MA_BASELINE |
| 14 | 2025-04-01 | tool_use | 4.025352 | 4.110964 | 0.131995 | -0.217608 | -6.346279 | 6.346279 | MA_BASELINE |
| 15 | 2026-04-01 | tool_use | 5.010635 | 4.027759 | 0.131995 | 0.850881 | 6.346279 | 6.346279 | MA_BASELINE |
| 16 | 2026-05-01 | rag | 5.468060 | 3.389279 | 0.824523 | 1.254258 | 6.078962 | 6.078962 | MA_BASELINE |
| 17 | 2025-05-01 | rag | 5.820083 | 5.490040 | 0.824523 | -0.494480 | -6.078962 | 6.078962 | MA_BASELINE |
| 18 | 2026-01-01 | rag | 5.736572 | 5.550336 | 0.652466 | -0.466230 | -5.882558 | 5.882558 | MA_BASELINE |
| 19 | 2025-01-01 | rag | 5.043425 | 3.164951 | 0.652466 | 1.226008 | 5.882558 | 5.882558 | MA_BASELINE |
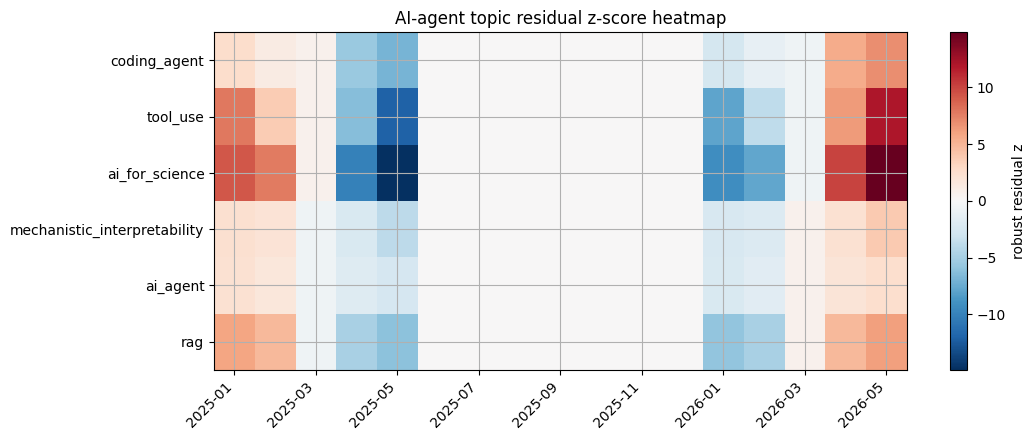
Visualization: AI-agent topic residual heatmap
The heatmap shows where residual shocks cluster across entities and time.
In [10]
residual_grid = components.copy()
residual_grid["residual_z"] = residual_grid.groupby("series")["residual"].transform(lambda s: (s - s.median()) / (1.4826 * (s - s.median()).abs().median() + 1e-12))
heat = residual_grid.pivot_table(index="series", columns="month", values="residual_z", aggfunc="mean")
heat = heat.reindex(priority["series"].tolist()).dropna(how="all")
values = heat.to_numpy(dtype=float)
absmax = float(np.nanmax(np.abs(values))) if np.isfinite(values).any() else 1.0
fig, ax = plt.subplots(figsize=(11, 4.5))
im = ax.imshow(values, aspect="auto", cmap="RdBu_r", vmin=-absmax, vmax=absmax)
ax.set_yticks(range(len(heat.index)))
ax.set_yticklabels(heat.index)
tick_step = max(1, len(heat.columns) // 8)
xticks = list(range(0, len(heat.columns), tick_step))
ax.set_xticks(xticks)
ax.set_xticklabels([pd.to_datetime(heat.columns[i]).strftime("%Y-%m") for i in xticks], rotation=45, ha="right")
ax.set_title("AI-agent topic residual z-score heatmap")
fig.colorbar(im, ax=ax, label="robust residual z")
plt.tight_layout()
plt.show()
image/png
7. Article outline template
In [11]
outline = pd.DataFrame([
    {"section": "Question", "content": "Which agent-related research topic is accelerating?"},
    {"section": "Source", "content": "arXiv API counts by query and submitted month."},
    {"section": "DeTime table", "content": "trend slope, cycle strength, residual shock rank."},
    {"section": "Interpretation scope", "content": "arXiv counts measure preprint volume; quality and adoption require separate evidence."},
])
outline
text/html
| section | content | |
|---|---|---|
| 0 | Question | Which agent-related research topic is accelera... |
| 1 | Source | arXiv API counts by query and submitted month. |
| 2 | DeTime table | trend slope, cycle strength, residual shock rank. |
| 3 | Interpretation scope | arXiv counts measure preprint volume; quality ... |
In [12]
save_table(audit, "02_arxiv_agent_topic_audit")
save_table(priority, "02_arxiv_agent_topic_priority")
save_table(events, "02_arxiv_agent_topic_residual_events")
save_table(outline, "02_arxiv_agent_article_outline")
stdout
saved: examples/hot_trends/outputs/02_arxiv_agent_topic_audit.csv
saved: examples/hot_trends/outputs/02_arxiv_agent_topic_priority.csv
saved: examples/hot_trends/outputs/02_arxiv_agent_topic_residual_events.csv
saved: examples/hot_trends/outputs/02_arxiv_agent_article_outline.csv