Crypto and Stablecoin Liquidity Pulse
Executed Notebook
This notebook asks whether BTC/ETH price residuals line up with current stablecoin liquidity context. It is a market-structure read, not a trading model.
The output is a CoinGecko source card, price decomposition, edge-trimmed residual events, and a current DeFiLlama stablecoin chain context table.
In [1]
from pathlib import Path
import os

import matplotlib.pyplot as plt
import numpy as np
import pandas as pd

from examples.hot_trends.data import (
    HotTrendDataError,
    append_real_snapshot,
    build_arxiv_monthly_counts,
    fetch_coingecko_market_chart,
    fetch_defillama_stablecoin_chains,
    fetch_github_repo_metadata,
    fetch_github_stargazers,
    fetch_huggingface_models,
    fetch_wikipedia_pageviews,
    source_audit_table,
)
from examples.hot_trends.decomposition import (
    component_summary,
    decompose_table,
    editorial_priority,
    residual_event_table,
)
from examples.hot_trends.scoring import article_publication_phrasing

pd.set_option("display.max_columns", 80)
pd.set_option("display.max_rows", 80)
plt.rcParams.update({"axes.grid": True})

CACHE_DIR = Path("examples/hot_trends/cache")
OUTPUT_DIR = Path("examples/hot_trends/outputs")
CACHE_DIR.mkdir(parents=True, exist_ok=True)
OUTPUT_DIR.mkdir(parents=True, exist_ok=True)

def save_table(df, name):
    path = OUTPUT_DIR / f"{name}.csv"
    df.to_csv(path, index=False)
    print(f"saved: {path.as_posix()}")
1. Fetch BTC and ETH market charts
In [2]
coins = ["bitcoin", "ethereum"]
frames = [fetch_coingecko_market_chart(c, days=365) for c in coins]
prices = pd.concat(frames, ignore_index=True)
prices.head(20)
text/html
|
date |
coin_id |
price |
source |
data_quality |
| 0 |
2025-05-23 |
bitcoin |
111560.356938 |
CoinGecko API |
public_api_snapshot |
| 1 |
2025-05-24 |
bitcoin |
107216.668569 |
CoinGecko API |
public_api_snapshot |
| 2 |
2025-05-25 |
bitcoin |
107831.363744 |
CoinGecko API |
public_api_snapshot |
| 3 |
2025-05-26 |
bitcoin |
108861.810377 |
CoinGecko API |
public_api_snapshot |
| 4 |
2025-05-27 |
bitcoin |
109377.715133 |
CoinGecko API |
public_api_snapshot |
| 5 |
2025-05-28 |
bitcoin |
109068.456949 |
CoinGecko API |
public_api_snapshot |
| 6 |
2025-05-29 |
bitcoin |
107838.184311 |
CoinGecko API |
public_api_snapshot |
| 7 |
2025-05-30 |
bitcoin |
105745.416604 |
CoinGecko API |
public_api_snapshot |
| 8 |
2025-05-31 |
bitcoin |
104010.919562 |
CoinGecko API |
public_api_snapshot |
| 9 |
2025-06-01 |
bitcoin |
104687.507429 |
CoinGecko API |
public_api_snapshot |
| 10 |
2025-06-02 |
bitcoin |
105710.005938 |
CoinGecko API |
public_api_snapshot |
| 11 |
2025-06-03 |
bitcoin |
105884.742632 |
CoinGecko API |
public_api_snapshot |
| 12 |
2025-06-04 |
bitcoin |
105434.477451 |
CoinGecko API |
public_api_snapshot |
| 13 |
2025-06-05 |
bitcoin |
104812.918219 |
CoinGecko API |
public_api_snapshot |
| 14 |
2025-06-06 |
bitcoin |
101650.738755 |
CoinGecko API |
public_api_snapshot |
| 15 |
2025-06-07 |
bitcoin |
104409.749680 |
CoinGecko API |
public_api_snapshot |
| 16 |
2025-06-08 |
bitcoin |
105681.454614 |
CoinGecko API |
public_api_snapshot |
| 17 |
2025-06-09 |
bitcoin |
105692.247407 |
CoinGecko API |
public_api_snapshot |
| 18 |
2025-06-10 |
bitcoin |
110261.574859 |
CoinGecko API |
public_api_snapshot |
| 19 |
2025-06-11 |
bitcoin |
110212.732521 |
CoinGecko API |
public_api_snapshot |
2. Source card and price audit
In [3]
audit = source_audit_table(prices, value_col="price", entity_col="coin_id", time_col="date")
source_card = pd.DataFrame([{
    "source": "CoinGecko API",
    "endpoint": "https://api.coingecko.com/api/v3/coins/{coin_id}/market_chart",
    "access_date": pd.Timestamp.today().date().isoformat(),
    "query_params": f"coins={','.join(coins)}; vs_currency=usd; days=365",
    "time_range": f"{prices['date'].min()} to {prices['date'].max()}",
    "cache_path": "not cached; outputs saved to examples/hot_trends/outputs",
    "interpretation_scope": "public BTC/ETH price history for market-structure context; not a trading signal",
}])
display(source_card)
audit
text/html
|
source |
endpoint |
access_date |
query_params |
time_range |
cache_path |
interpretation_scope |
| 0 |
CoinGecko API |
https://api.coingecko.com/api/v3/coins/{coin_i... |
2026-05-22 |
coins=bitcoin,ethereum; vs_currency=usd; days=365 |
2025-05-23 to 2026-05-22 |
not cached; outputs saved to examples/hot_tren... |
public BTC/ETH price history for market-struct... |
text/html
|
series |
first_timestamp |
last_timestamp |
observations |
missing_ratio |
min_value |
max_value |
| 0 |
bitcoin |
2025-05-23 00:00:00 |
2026-05-22 00:00:00 |
366 |
0.0 |
62853.690384 |
124773.508231 |
| 1 |
ethereum |
2025-05-23 00:00:00 |
2026-05-22 00:00:00 |
366 |
0.0 |
1820.569322 |
4829.225542 |
3. Decompose crypto price series
In [4]
components = decompose_table(prices, entity_col="coin_id", time_col="date", value_col="price", method="MA_BASELINE", period=7, trend_window=21, transform="log")
summary = editorial_priority(component_summary(components, entity_col="coin_id", time_col="date"), entity_col="coin_id")
summary
text/html
|
coin_id |
observations |
first_timestamp |
last_timestamp |
trend_last |
trend_slope_per_step |
cycle_strength_proxy |
residual_std |
max_abs_residual_z |
method |
trend_slope_per_step_rank_pct |
cycle_strength_proxy_rank_pct |
max_abs_residual_z_rank_pct |
editorial_priority_score |
| 1 |
ethereum |
366 |
2025-05-23 00:00:00 |
2026-05-22 00:00:00 |
4.024828 |
-0.001398 |
-2.723404 |
0.523068 |
64.310751 |
MA_BASELINE |
1.0 |
1.0 |
0.5 |
0.775 |
| 0 |
bitcoin |
366 |
2025-05-23 00:00:00 |
2026-05-22 00:00:00 |
5.901470 |
-0.001547 |
-14.428352 |
0.770613 |
125.749236 |
MA_BASELINE |
0.5 |
0.5 |
1.0 |
0.725 |
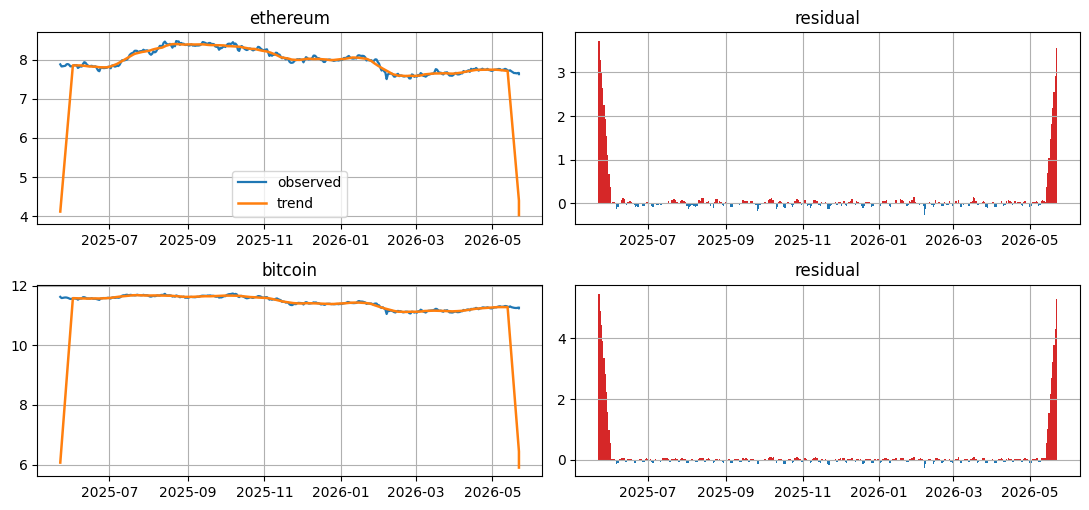
Visualization: crypto price components
The left panels plot transformed observed price and trend by coin. The right panels plot residuals from the smooth baseline. Large bars mark dates for follow-up research; they are not entry or exit rules.
In [5]
coins_to_plot = summary["coin_id"].tolist()
fig, axes = plt.subplots(len(coins_to_plot), 2, figsize=(11, max(3.0, 2.6 * len(coins_to_plot))), squeeze=False)
for row, coin_id in enumerate(coins_to_plot):
    panel = components.loc[components["coin_id"].eq(coin_id)].sort_values("date").copy()
    panel["date"] = pd.to_datetime(panel["date"])
    axes[row, 0].plot(panel["date"], panel["observed"], label="observed", linewidth=1.6)
    axes[row, 0].plot(panel["date"], panel["trend"], label="trend", linewidth=1.8)
    axes[row, 0].set_title(coin_id)
    axes[row, 1].bar(panel["date"], panel["residual"], color=np.where(panel["residual"] >= 0, "tab:red", "tab:blue"), width=1.0)
    axes[row, 1].set_title("residual")
axes[0, 0].legend(loc="best")
plt.tight_layout()
plt.show()
image/png
4. Residual events
In [6]
events = residual_event_table(components, entity_col="coin_id", time_col="date", top_n=20, trim_edges=21)
events
text/html
|
date |
coin_id |
observed |
trend |
season |
residual |
residual_z |
abs_residual_z |
method |
| 0 |
2026-02-06 |
bitcoin |
11.048565 |
11.217366 |
0.080617 |
-0.249418 |
-5.836389 |
5.836389 |
MA_BASELINE |
| 1 |
2026-02-06 |
ethereum |
7.506905 |
7.724144 |
0.052559 |
-0.269798 |
-4.931441 |
4.931441 |
MA_BASELINE |
| 2 |
2025-11-22 |
bitcoin |
11.351016 |
11.423804 |
0.079376 |
-0.152163 |
-3.705549 |
3.705549 |
MA_BASELINE |
| 3 |
2025-11-21 |
bitcoin |
11.369632 |
11.433564 |
0.080617 |
-0.144549 |
-3.538715 |
3.538715 |
MA_BASELINE |
| 4 |
2025-09-26 |
bitcoin |
11.598769 |
11.656836 |
0.080617 |
-0.138685 |
-3.410229 |
3.410229 |
MA_BASELINE |
| 5 |
2025-09-27 |
bitcoin |
11.605598 |
11.660556 |
0.079376 |
-0.134334 |
-3.314907 |
3.314907 |
MA_BASELINE |
| 6 |
2025-10-18 |
bitcoin |
11.575371 |
11.630168 |
0.079376 |
-0.134173 |
-3.311382 |
3.311382 |
MA_BASELINE |
| 7 |
2025-10-17 |
bitcoin |
11.590597 |
11.634392 |
0.080617 |
-0.124412 |
-3.097521 |
3.097521 |
MA_BASELINE |
| 8 |
2026-02-13 |
bitcoin |
11.100203 |
11.143801 |
0.080617 |
-0.124215 |
-3.093204 |
3.093204 |
MA_BASELINE |
| 9 |
2025-09-26 |
ethereum |
8.259216 |
8.371748 |
0.052559 |
-0.165091 |
-3.043532 |
3.043532 |
MA_BASELINE |
| 10 |
2026-02-07 |
bitcoin |
11.163708 |
11.205553 |
0.079376 |
-0.121221 |
-3.027601 |
3.027601 |
MA_BASELINE |
| 11 |
2025-12-19 |
bitcoin |
11.355691 |
11.391919 |
0.080617 |
-0.116846 |
-2.931733 |
2.931733 |
MA_BASELINE |
| 12 |
2026-03-28 |
bitcoin |
11.102262 |
11.138202 |
0.079376 |
-0.115315 |
-2.898206 |
2.898206 |
MA_BASELINE |
| 13 |
2026-04-04 |
bitcoin |
11.111547 |
11.146993 |
0.079376 |
-0.114821 |
-2.887373 |
2.887373 |
MA_BASELINE |
| 14 |
2026-04-03 |
bitcoin |
11.110830 |
11.144620 |
0.080617 |
-0.114407 |
-2.878312 |
2.878312 |
MA_BASELINE |
| 15 |
2025-08-02 |
bitcoin |
11.637217 |
11.668642 |
0.079376 |
-0.110801 |
-2.799291 |
2.799291 |
MA_BASELINE |
| 16 |
2025-11-07 |
bitcoin |
11.526065 |
11.555237 |
0.080617 |
-0.109789 |
-2.777114 |
2.777114 |
MA_BASELINE |
| 17 |
2026-05-01 |
bitcoin |
11.242252 |
11.270734 |
0.080617 |
-0.109099 |
-2.762009 |
2.762009 |
MA_BASELINE |
| 18 |
2025-08-30 |
bitcoin |
11.594324 |
11.622299 |
0.079376 |
-0.107350 |
-2.723693 |
2.723693 |
MA_BASELINE |
| 19 |
2025-06-21 |
bitcoin |
11.545297 |
11.570234 |
0.079376 |
-0.104313 |
-2.657139 |
2.657139 |
MA_BASELINE |
5. Fetch current stablecoin context from DeFiLlama
This cell reads the current DeFiLlama stablecoin endpoint schema and records the table used for the liquidity context. It does not measure historical stablecoin-supply change.
In [7]
stablecoin_source_card = pd.DataFrame([{
    "source": "DeFiLlama stablecoin API",
    "endpoint": "https://stablecoins.llama.fi/stablecoins?includePrices=true",
    "access_date": pd.Timestamp.today().date().isoformat(),
    "query_params": "includePrices=true",
    "time_range": "current endpoint snapshot",
    "cache_path": "not cached; outputs saved to examples/hot_trends/outputs",
    "interpretation_scope": "current stablecoin chain supply context; not executable liquidity or a trading signal",
}])
stable_chains = fetch_defillama_stablecoin_chains()
display(stablecoin_source_card)
stable_chains.head(20)
text/html
|
source |
endpoint |
access_date |
query_params |
time_range |
cache_path |
interpretation_scope |
| 0 |
DeFiLlama stablecoin API |
https://stablecoins.llama.fi/stablecoins?inclu... |
2026-05-22 |
includePrices=true |
current endpoint snapshot |
not cached; outputs saved to examples/hot_tren... |
current stablecoin chain supply context; not e... |
text/html
|
totalCirculatingUSD |
name |
| 0 |
{'peggedUSD': 7231293.297661571} |
Manta |
| 1 |
{'peggedUSD': 475472.9230870892} |
ThunderCore |
| 2 |
{'peggedUSD': 39708611.36492221} |
Movement |
| 3 |
{'peggedUSD': 32717.41461544214} |
Shiden |
| 4 |
{'peggedUSD': 138869.81749023663} |
Corn |
| 5 |
{'peggedUSD': 346081964.99845433} |
Starknet |
| 6 |
{'peggedUSD': 90328483811.95787, 'peggedREAL':... |
Tron |
| 7 |
{'peggedUSD': 3539355.889837592} |
CORE |
| 8 |
{'peggedUSD': 285081.514346732} |
ApeChain |
| 9 |
{'peggedUSD': 3776681.058702138, 'peggedSGD': ... |
Zilliqa |
| 10 |
{'peggedUSD': 1064183.4439790852} |
Peaq |
| 11 |
{'peggedUSD': 0} |
Evmos |
| 12 |
{'peggedUSD': 0} |
Milkomeda C1 (Deprecated) |
| 13 |
{'peggedUSD': 407198921.19447505} |
Monad |
| 14 |
{'peggedUSD': 0} |
SX Network |
| 15 |
{'peggedUSD': 1825106351.7395616} |
Aptos |
| 16 |
{'peggedUSD': 54455011.663982846, 'peggedCHF':... |
Tezos |
| 17 |
{'peggedUSD': 33546534.18344099} |
PulseChain |
| 18 |
{'peggedUSD': 239458.1044466233} |
Kusama |
| 19 |
{'peggedUSD': 11658640.89012045} |
Immutable zkEVM |
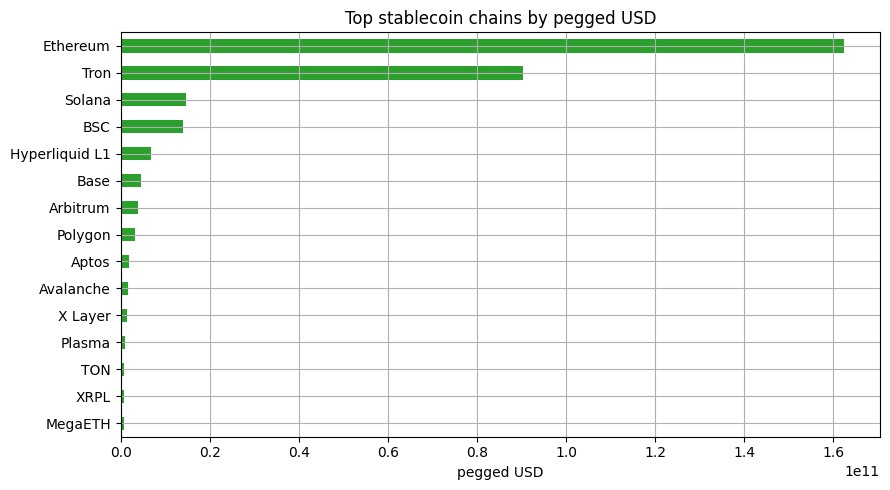
Visualization: current stablecoin chain context
The x-axis is current pegged USD by chain from DeFiLlama. Use it to size the liquidity backdrop around BTC/ETH residual dates; do not read it as historical flow or available execution depth.
In [8]
def _pegged_usd(value):
    if isinstance(value, dict):
        return float(value.get("peggedUSD") or 0.0)
    return float(value or 0.0)

stable_context = stable_chains.assign(pegged_usd=stable_chains["totalCirculatingUSD"].map(_pegged_usd))
stable_context = stable_context.sort_values("pegged_usd", ascending=False).head(15).sort_values("pegged_usd")
ax = stable_context.plot(kind="barh", x="name", y="pegged_usd", figsize=(9, 5), color="tab:green", legend=False, title="Top stablecoin chains by pegged USD")
ax.set_xlabel("pegged USD")
ax.set_ylabel("")
plt.tight_layout()
plt.show()
image/png
6. Publication language
In [9]
phrasing = article_publication_phrasing()
phrasing
text/html
|
draft_claim |
evidence_based_phrasing |
| 0 |
This trend predicts the next price move. |
This trend summarizes the observed public seri... |
| 1 |
This model is better because it has more downl... |
Downloads are a public adoption proxy interpre... |
| 2 |
This repo is winning because stars are rising. |
Star velocity measures developer attention for... |
| 3 |
This pageview spike shows the topic matters most. |
Pageviews measure public attention during the ... |
| 4 |
This residual is a buy signal. |
This residual marks an event-like deviation fr... |
In [10]
save_table(source_card, "06_coingecko_source_card")
save_table(stablecoin_source_card, "06_defillama_source_card")
save_table(audit, "06_crypto_price_audit")
save_table(summary, "06_crypto_price_summary")
save_table(events, "06_crypto_price_residual_events")
save_table(stable_chains, "06_defillama_stablecoin_context")
save_table(phrasing, "06_crypto_publication_phrasing")
stdout
saved: examples/hot_trends/outputs/06_coingecko_source_card.csv
saved: examples/hot_trends/outputs/06_defillama_source_card.csv
saved: examples/hot_trends/outputs/06_crypto_price_audit.csv
saved: examples/hot_trends/outputs/06_crypto_price_summary.csv
saved: examples/hot_trends/outputs/06_crypto_price_residual_events.csv
saved: examples/hot_trends/outputs/06_defillama_stablecoin_context.csv
saved: examples/hot_trends/outputs/06_crypto_publication_phrasing.csv