Hugging Face Open-Model Pulse
Executed Notebook
This notebook asks what a dated Hugging Face public snapshot can and cannot say about open-model attention. A single snapshot supports a current adoption-proxy table; repeated snapshots are required before discussing momentum, acceleration, or retention.
The main output is a source card, a snapshot ranking, and, when enough dated snapshots exist, a decomposition of repeated download observations.
In [1]
from pathlib import Path
import os

import matplotlib.pyplot as plt
import numpy as np
import pandas as pd

from examples.hot_trends.data import (
    HotTrendDataError,
    append_real_snapshot,
    build_arxiv_monthly_counts,
    fetch_coingecko_market_chart,
    fetch_defillama_stablecoin_chains,
    fetch_github_repo_metadata,
    fetch_github_stargazers,
    fetch_huggingface_models,
    fetch_wikipedia_pageviews,
    source_audit_table,
)
from examples.hot_trends.decomposition import (
    component_summary,
    decompose_table,
    editorial_priority,
    residual_event_table,
)
from examples.hot_trends.scoring import article_publication_phrasing

pd.set_option("display.max_columns", 80)
pd.set_option("display.max_rows", 80)
plt.rcParams.update({"axes.grid": True})

CACHE_DIR = Path("examples/hot_trends/cache")
OUTPUT_DIR = Path("examples/hot_trends/outputs")
CACHE_DIR.mkdir(parents=True, exist_ok=True)
OUTPUT_DIR.mkdir(parents=True, exist_ok=True)

def save_table(df, name):
    path = OUTPUT_DIR / f"{name}.csv"
    df.to_csv(path, index=False)
    print(f"saved: {path.as_posix()}")
1. Fetch a model snapshot
In [2]
HF_LIMIT = 50
HF_SORT = "downloads"
HF_DIRECTION = -1
hf_endpoint = f"https://huggingface.co/api/models?limit={HF_LIMIT}&sort={HF_SORT}&direction={HF_DIRECTION}"
snapshot = fetch_huggingface_models(limit=HF_LIMIT, sort=HF_SORT, direction=HF_DIRECTION)
snapshot.head(20)
text/html
|
snapshot_date |
model_id |
pipeline_tag |
downloads |
likes |
last_modified |
private |
source |
data_quality |
| 0 |
2026-05-22 |
sentence-transformers/all-MiniLM-L6-v2 |
sentence-similarity |
260087615 |
4820 |
None |
False |
Hugging Face Hub API |
public_api_snapshot |
| 1 |
2026-05-22 |
Qwen/Qwen3-VL-2B-Instruct |
image-text-to-text |
89788352 |
411 |
None |
False |
Hugging Face Hub API |
public_api_snapshot |
| 2 |
2026-05-22 |
google-bert/bert-base-uncased |
fill-mask |
69840940 |
2660 |
None |
False |
Hugging Face Hub API |
public_api_snapshot |
| 3 |
2026-05-22 |
cross-encoder/ms-marco-MiniLM-L6-v2 |
text-ranking |
58885551 |
242 |
None |
False |
Hugging Face Hub API |
public_api_snapshot |
| 4 |
2026-05-22 |
google/electra-base-discriminator |
None |
56163043 |
110 |
None |
False |
Hugging Face Hub API |
public_api_snapshot |
| 5 |
2026-05-22 |
sentence-transformers/paraphrase-multilingual-... |
sentence-similarity |
48940452 |
1234 |
None |
False |
Hugging Face Hub API |
public_api_snapshot |
| 6 |
2026-05-22 |
BAAI/bge-small-en-v1.5 |
feature-extraction |
47753766 |
467 |
None |
False |
Hugging Face Hub API |
public_api_snapshot |
| 7 |
2026-05-22 |
sentence-transformers/all-mpnet-base-v2 |
sentence-similarity |
35311317 |
1294 |
None |
False |
Hugging Face Hub API |
public_api_snapshot |
| 8 |
2026-05-22 |
openai/clip-vit-large-patch14 |
zero-shot-image-classification |
31831707 |
2014 |
None |
False |
Hugging Face Hub API |
public_api_snapshot |
| 9 |
2026-05-22 |
BAAI/bge-m3 |
sentence-similarity |
28332931 |
3031 |
None |
False |
Hugging Face Hub API |
public_api_snapshot |
| 10 |
2026-05-22 |
FacebookAI/xlm-roberta-base |
fill-mask |
22126670 |
832 |
None |
False |
Hugging Face Hub API |
public_api_snapshot |
| 11 |
2026-05-22 |
openai/clip-vit-base-patch32 |
zero-shot-image-classification |
21761723 |
939 |
None |
False |
Hugging Face Hub API |
public_api_snapshot |
| 12 |
2026-05-22 |
FacebookAI/roberta-large |
fill-mask |
21471165 |
291 |
None |
False |
Hugging Face Hub API |
public_api_snapshot |
| 13 |
2026-05-22 |
laion/clap-htsat-fused |
audio-classification |
20521489 |
90 |
None |
False |
Hugging Face Hub API |
public_api_snapshot |
| 14 |
2026-05-22 |
colbert-ir/colbertv2.0 |
None |
18507347 |
346 |
None |
False |
Hugging Face Hub API |
public_api_snapshot |
| 15 |
2026-05-22 |
Qwen/Qwen3-0.6B |
text-generation |
18331817 |
1262 |
None |
False |
Hugging Face Hub API |
public_api_snapshot |
| 16 |
2026-05-22 |
openai-community/gpt2 |
text-generation |
17502119 |
3255 |
None |
False |
Hugging Face Hub API |
public_api_snapshot |
| 17 |
2026-05-22 |
nomic-ai/nomic-embed-text-v1.5 |
sentence-similarity |
17123670 |
833 |
None |
False |
Hugging Face Hub API |
public_api_snapshot |
| 18 |
2026-05-22 |
FacebookAI/roberta-base |
fill-mask |
16996355 |
603 |
None |
False |
Hugging Face Hub API |
public_api_snapshot |
| 19 |
2026-05-22 |
amazon/chronos-2 |
time-series-forecasting |
15606352 |
291 |
None |
False |
Hugging Face Hub API |
public_api_snapshot |
2. Source card and snapshot audit
In [3]
source_card = pd.DataFrame([{
    "source": "Hugging Face Hub API",
    "endpoint": hf_endpoint,
    "access_date": snapshot["snapshot_date"].iloc[0],
    "query_params": f"limit={HF_LIMIT}; sort={HF_SORT}; direction={HF_DIRECTION}",
    "time_range": f"snapshot_date={snapshot['snapshot_date'].iloc[0]}",
    "cache_path": "examples/hot_trends/cache/hf_model_snapshot_log.csv",
    "metric_semantics": "downloads and likes are public Hub metadata fields in a dated API response",
    "interpretation_scope": "single snapshot = current public adoption proxy; repeated snapshots required for momentum",
}])
snapshot_audit = pd.DataFrame([{
    "snapshot_date": snapshot["snapshot_date"].iloc[0],
    "models": int(len(snapshot)),
    "non_null_downloads": int(snapshot["downloads"].notna().sum()),
    "non_null_likes": int(snapshot["likes"].notna().sum()),
    "source": "Hugging Face Hub API",
    "endpoint": hf_endpoint,
    "query_params": source_card.loc[0, "query_params"],
    "interpretation_scope": source_card.loc[0, "interpretation_scope"],
}])
display(source_card)
snapshot_audit
text/html
|
source |
endpoint |
access_date |
query_params |
time_range |
cache_path |
metric_semantics |
interpretation_scope |
| 0 |
Hugging Face Hub API |
https://huggingface.co/api/models?limit=50&sor... |
2026-05-22 |
limit=50; sort=downloads; direction=-1 |
snapshot_date=2026-05-22 |
examples/hot_trends/cache/hf_model_snapshot_lo... |
downloads and likes are public Hub metadata fi... |
single snapshot = current public adoption prox... |
text/html
|
snapshot_date |
models |
non_null_downloads |
non_null_likes |
source |
endpoint |
query_params |
interpretation_scope |
| 0 |
2026-05-22 |
50 |
50 |
50 |
Hugging Face Hub API |
https://huggingface.co/api/models?limit=50&sor... |
limit=50; sort=downloads; direction=-1 |
single snapshot = current public adoption prox... |
3. Append snapshot to a dated local log
Each row records a Hugging Face API snapshot. The notebook deduplicates same-day (snapshot_date, model_id) rows before writing the log so repeated runs do not create false momentum.
In [4]
log_path = CACHE_DIR / "hf_model_snapshot_log.csv"
snapshot_for_log = snapshot.sort_values("last_modified").drop_duplicates(["snapshot_date", "model_id"], keep="last")
log = append_real_snapshot(snapshot_for_log, log_path)
log = log.drop_duplicates(["snapshot_date", "model_id"], keep="last").sort_values(["snapshot_date", "model_id"])
log.to_csv(log_path, index=False)
log.tail(20)
text/html
|
snapshot_date |
model_id |
pipeline_tag |
downloads |
likes |
last_modified |
private |
source |
data_quality |
| 289 |
2026-05-22 |
google/gemma-4-26B-A4B-it |
image-text-to-text |
9742603 |
988 |
None |
False |
Hugging Face Hub API |
public_api_snapshot |
| 284 |
2026-05-22 |
google/gemma-4-31B-it |
image-text-to-text |
10283716 |
2730 |
None |
False |
Hugging Face Hub API |
public_api_snapshot |
| 281 |
2026-05-22 |
hexgrad/Kokoro-82M |
text-to-speech |
10756374 |
6192 |
None |
False |
Hugging Face Hub API |
public_api_snapshot |
| 293 |
2026-05-22 |
intfloat/multilingual-e5-small |
sentence-similarity |
8619360 |
324 |
None |
False |
Hugging Face Hub API |
public_api_snapshot |
| 263 |
2026-05-22 |
laion/clap-htsat-fused |
audio-classification |
20521489 |
90 |
None |
False |
Hugging Face Hub API |
public_api_snapshot |
| 274 |
2026-05-22 |
lpiccinelli/unidepth-v2-vitl14 |
None |
13797346 |
19 |
None |
False |
Hugging Face Hub API |
public_api_snapshot |
| 280 |
2026-05-22 |
meta-llama/Llama-3.1-8B-Instruct |
text-generation |
10815581 |
5874 |
None |
False |
Hugging Face Hub API |
public_api_snapshot |
| 296 |
2026-05-22 |
meta-llama/Llama-3.2-1B-Instruct |
text-generation |
8034700 |
1421 |
None |
False |
Hugging Face Hub API |
public_api_snapshot |
| 267 |
2026-05-22 |
nomic-ai/nomic-embed-text-v1.5 |
sentence-similarity |
17123670 |
833 |
None |
False |
Hugging Face Hub API |
public_api_snapshot |
| 266 |
2026-05-22 |
openai-community/gpt2 |
text-generation |
17502119 |
3255 |
None |
False |
Hugging Face Hub API |
public_api_snapshot |
| 261 |
2026-05-22 |
openai/clip-vit-base-patch32 |
zero-shot-image-classification |
21761723 |
939 |
None |
False |
Hugging Face Hub API |
public_api_snapshot |
| 258 |
2026-05-22 |
openai/clip-vit-large-patch14 |
zero-shot-image-classification |
31831707 |
2014 |
None |
False |
Hugging Face Hub API |
public_api_snapshot |
| 297 |
2026-05-22 |
openai/gpt-oss-20b |
text-generation |
7969576 |
4631 |
None |
False |
Hugging Face Hub API |
public_api_snapshot |
| 290 |
2026-05-22 |
pyannote/segmentation-3.0 |
voice-activity-detection |
9734596 |
1008 |
None |
False |
Hugging Face Hub API |
public_api_snapshot |
| 285 |
2026-05-22 |
pyannote/speaker-diarization-3.1 |
automatic-speech-recognition |
10263344 |
1924 |
None |
False |
Hugging Face Hub API |
public_api_snapshot |
| 283 |
2026-05-22 |
pyannote/wespeaker-voxceleb-resnet34-LM |
None |
10673775 |
133 |
None |
False |
Hugging Face Hub API |
public_api_snapshot |
| 250 |
2026-05-22 |
sentence-transformers/all-MiniLM-L6-v2 |
sentence-similarity |
260087615 |
4820 |
None |
False |
Hugging Face Hub API |
public_api_snapshot |
| 257 |
2026-05-22 |
sentence-transformers/all-mpnet-base-v2 |
sentence-similarity |
35311317 |
1294 |
None |
False |
Hugging Face Hub API |
public_api_snapshot |
| 255 |
2026-05-22 |
sentence-transformers/paraphrase-multilingual-... |
sentence-similarity |
48940452 |
1234 |
None |
False |
Hugging Face Hub API |
public_api_snapshot |
| 275 |
2026-05-22 |
timm/mobilenetv3_small_100.lamb_in1k |
image-classification |
13766094 |
73 |
None |
False |
Hugging Face Hub API |
public_api_snapshot |
4. Convert repeated snapshots to a time series if enough data exists
In [5]
log["snapshot_date"] = pd.to_datetime(log["snapshot_date"])
log["downloads"] = pd.to_numeric(log["downloads"], errors="coerce")
series_log = log.dropna(subset=["model_id", "downloads"]).sort_values(["model_id", "snapshot_date"])
ready_models = series_log.groupby("model_id")["snapshot_date"].nunique().loc[lambda s: s >= 4].index.tolist()
ready_models[:10], len(ready_models)
5. Decompose only after repeated snapshots exist
The chart becomes a momentum read only after the same API query has been collected across enough dates. Until then, the notebook publishes the current snapshot table and the collection-depth chart.
In [6]
if ready_models:
    decomp_input = series_log[series_log["model_id"].isin(ready_models)].rename(columns={"snapshot_date": "date", "model_id": "series", "downloads": "count"})
    decomp_input = decomp_input.dropna(subset=["count"])
    components = decompose_table(decomp_input, entity_col="series", time_col="date", value_col="count", method="MA_BASELINE", period=7, trend_window=3, transform="log1p")
    summary = editorial_priority(component_summary(components, entity_col="series", time_col="date"), entity_col="series")
    events = residual_event_table(components, entity_col="series", time_col="date", top_n=20, trim_edges=1)
else:
    components = pd.DataFrame()
    summary = pd.DataFrame([{"status": "not_enough_snapshots", "required": "collect at least 4 snapshot dates per model before decomposition"}])
    events = pd.DataFrame()
summary
text/html
|
status |
required |
| 0 |
not_enough_snapshots |
collect at least 4 snapshot dates per model be... |
This table is cross-sectional. The axes to read are downloads and likes in the selected API response; do not read the ranking as momentum or model quality.
In [7]
snapshot_rank = snapshot.sort_values(["downloads", "likes"], ascending=False, na_position="last").head(25)
snapshot_rank[["model_id", "pipeline_tag", "downloads", "likes", "last_modified", "source"]]
text/html
|
model_id |
pipeline_tag |
downloads |
likes |
last_modified |
source |
| 0 |
sentence-transformers/all-MiniLM-L6-v2 |
sentence-similarity |
260087615 |
4820 |
None |
Hugging Face Hub API |
| 1 |
Qwen/Qwen3-VL-2B-Instruct |
image-text-to-text |
89788352 |
411 |
None |
Hugging Face Hub API |
| 2 |
google-bert/bert-base-uncased |
fill-mask |
69840940 |
2660 |
None |
Hugging Face Hub API |
| 3 |
cross-encoder/ms-marco-MiniLM-L6-v2 |
text-ranking |
58885551 |
242 |
None |
Hugging Face Hub API |
| 4 |
google/electra-base-discriminator |
None |
56163043 |
110 |
None |
Hugging Face Hub API |
| 5 |
sentence-transformers/paraphrase-multilingual-... |
sentence-similarity |
48940452 |
1234 |
None |
Hugging Face Hub API |
| 6 |
BAAI/bge-small-en-v1.5 |
feature-extraction |
47753766 |
467 |
None |
Hugging Face Hub API |
| 7 |
sentence-transformers/all-mpnet-base-v2 |
sentence-similarity |
35311317 |
1294 |
None |
Hugging Face Hub API |
| 8 |
openai/clip-vit-large-patch14 |
zero-shot-image-classification |
31831707 |
2014 |
None |
Hugging Face Hub API |
| 9 |
BAAI/bge-m3 |
sentence-similarity |
28332931 |
3031 |
None |
Hugging Face Hub API |
| 10 |
FacebookAI/xlm-roberta-base |
fill-mask |
22126670 |
832 |
None |
Hugging Face Hub API |
| 11 |
openai/clip-vit-base-patch32 |
zero-shot-image-classification |
21761723 |
939 |
None |
Hugging Face Hub API |
| 12 |
FacebookAI/roberta-large |
fill-mask |
21471165 |
291 |
None |
Hugging Face Hub API |
| 13 |
laion/clap-htsat-fused |
audio-classification |
20521489 |
90 |
None |
Hugging Face Hub API |
| 14 |
colbert-ir/colbertv2.0 |
None |
18507347 |
346 |
None |
Hugging Face Hub API |
| 15 |
Qwen/Qwen3-0.6B |
text-generation |
18331817 |
1262 |
None |
Hugging Face Hub API |
| 16 |
openai-community/gpt2 |
text-generation |
17502119 |
3255 |
None |
Hugging Face Hub API |
| 17 |
nomic-ai/nomic-embed-text-v1.5 |
sentence-similarity |
17123670 |
833 |
None |
Hugging Face Hub API |
| 18 |
FacebookAI/roberta-base |
fill-mask |
16996355 |
603 |
None |
Hugging Face Hub API |
| 19 |
amazon/chronos-2 |
time-series-forecasting |
15606352 |
291 |
None |
Hugging Face Hub API |
| 20 |
distilbert/distilbert-base-uncased |
fill-mask |
15393638 |
882 |
None |
Hugging Face Hub API |
| 21 |
Bingsu/adetailer |
None |
15072960 |
702 |
None |
Hugging Face Hub API |
| 22 |
BAAI/bge-large-en-v1.5 |
feature-extraction |
14646385 |
667 |
None |
Hugging Face Hub API |
| 23 |
Qwen/Qwen2.5-1.5B-Instruct |
text-generation |
14311666 |
704 |
None |
Hugging Face Hub API |
| 24 |
lpiccinelli/unidepth-v2-vitl14 |
None |
13797346 |
19 |
None |
Hugging Face Hub API |
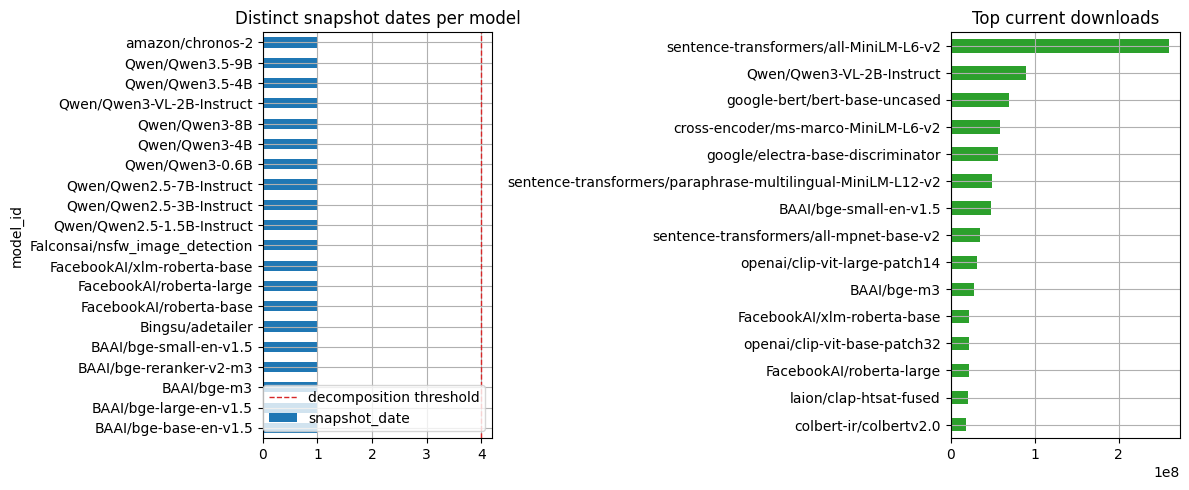
Visualization: Hugging Face snapshot status
The left panel reports snapshot depth by model. The dashed line is the minimum repeated-snapshot threshold used before decomposition. The right panel reports current downloads from one dated snapshot, which is useful for a source table but not for retention claims.
In [8]
if not components.empty and "series" in summary.columns:
    top_models = summary["series"].head(4).tolist()
    fig, axes = plt.subplots(len(top_models), 2, figsize=(11, max(3.0, 2.4 * len(top_models))), squeeze=False)
    for row, model_id in enumerate(top_models):
        panel = components.loc[components["series"].eq(model_id)].sort_values("date").copy()
        panel["date"] = pd.to_datetime(panel["date"])
        axes[row, 0].plot(panel["date"], panel["observed"], label="observed", linewidth=1.6)
        axes[row, 0].plot(panel["date"], panel["trend"], label="trend", linewidth=1.8)
        axes[row, 0].set_title(model_id)
        axes[row, 1].bar(panel["date"], panel["residual"], color=np.where(panel["residual"] >= 0, "tab:red", "tab:blue"))
        axes[row, 1].set_title("residual")
    axes[0, 0].legend(loc="best")
else:
    snapshot_depth = series_log.groupby("model_id")["snapshot_date"].nunique().sort_values(ascending=False).head(20)
    top_downloads = snapshot_rank.dropna(subset=["downloads"]).head(15).sort_values("downloads")
    fig, axes = plt.subplots(1, 2, figsize=(12, 5))
    snapshot_depth.sort_values().plot(kind="barh", ax=axes[0], color="tab:blue", title="Distinct snapshot dates per model")
    axes[0].axvline(4, color="tab:red", linestyle="--", linewidth=1.0, label="decomposition threshold")
    axes[0].legend(loc="lower right")
    top_downloads.plot(kind="barh", x="model_id", y="downloads", ax=axes[1], color="tab:green", legend=False, title="Top current downloads")
    axes[1].set_ylabel("")
plt.tight_layout()
plt.show()
image/png
7. Publication language
In [9]
phrasing = article_publication_phrasing()
phrasing
text/html
|
draft_claim |
evidence_based_phrasing |
| 0 |
This trend predicts the next price move. |
This trend summarizes the observed public seri... |
| 1 |
This model is better because it has more downl... |
Downloads are a public adoption proxy interpre... |
| 2 |
This repo is winning because stars are rising. |
Star velocity measures developer attention for... |
| 3 |
This pageview spike shows the topic matters most. |
Pageviews measure public attention during the ... |
| 4 |
This residual is a buy signal. |
This residual marks an event-like deviation fr... |
In [10]
save_table(source_card, "03_hf_source_card")
save_table(snapshot_audit, "03_hf_snapshot_audit")
save_table(snapshot_rank, "03_hf_snapshot_rank")
save_table(summary, "03_hf_decomposition_or_collection_status")
if not events.empty:
    save_table(events, "03_hf_residual_events")
save_table(phrasing, "03_hf_publication_phrasing")
stdout
saved: examples/hot_trends/outputs/03_hf_source_card.csv
saved: examples/hot_trends/outputs/03_hf_snapshot_audit.csv
saved: examples/hot_trends/outputs/03_hf_snapshot_rank.csv
saved: examples/hot_trends/outputs/03_hf_decomposition_or_collection_status.csv
saved: examples/hot_trends/outputs/03_hf_publication_phrasing.csv