De-Time Method Gallery
Note
Go to the end to download the full notebook, Python source, or zipped example.
Go to the end to download the full notebook, Python source, or zipped example.
This gallery follows the same pattern as a Sphinx-Gallery example page: short explanation, executable code blocks, printed output, figures, and download links. The examples use compact synthetic data so they run quickly in docs builds and local checkouts.
Regenerate this page and its assets with python scripts/generate_notebook_gallery.py.
Imports and synthetic data
import sys
import warnings
from pathlib import Path

import matplotlib.pyplot as plt
import numpy as np
import pandas as pd
from IPython.display import display

# Prefer the checkout when this notebook is run inside the repository.
repo_src = Path.cwd() / "src"
if (repo_src / "detime").exists():
    sys.meta_path[:] = [
        finder for finder in sys.meta_path
        if finder.__class__.__module__ != "_de_time_editable"
    ]
    sys.path.insert(0, str(repo_src))

from detime import DecompositionConfig, MethodRegistry, decompose

warnings.filterwarnings("ignore", category=FutureWarning)
plt.rcParams.update(
    {
        "figure.figsize": (7.6, 3.0),
        "figure.dpi": 130,
        "savefig.dpi": 220,
        "axes.grid": False,
        "axes.spines.top": False,
        "axes.spines.right": False,
        "font.size": 10,
    }
)

rng = np.random.default_rng(42)
t = np.arange(96, dtype=float)
seasonal = np.sin(2.0 * np.pi * t / 12.0)
slow = 0.018 * t + 0.25 * np.sin(2.0 * np.pi * t / 48.0)
noise = 0.05 * rng.standard_normal(t.shape)
series = slow + seasonal + noise
panel = np.column_stack(
    [
        series,
        0.8 * slow + np.sin(2.0 * np.pi * (t + 2.0) / 12.0) + 0.04 * rng.standard_normal(t.shape),
        1.15 * slow + 0.7 * np.sin(2.0 * np.pi * (t + 4.0) / 12.0) + 0.04 * rng.standard_normal(t.shape),
    ]
)

CASES = {
    "SSA": {"data": series, "config": {"method": "SSA", "params": {"window": 24, "rank": 6, "primary_period": 12}, "backend": "auto", "speed_mode": "exact"}},
    "STD": {"data": series, "config": {"method": "STD", "params": {"period": 12}, "backend": "auto"}},
    "STDR": {"data": series, "config": {"method": "STDR", "params": {"period": 12}, "backend": "auto"}},
    "MSSA": {"data": panel, "config": {"method": "MSSA", "params": {"window": 24, "rank": 6, "primary_period": 12}, "backend": "python", "channel_names": ["a", "b", "c"]}},
    "STL": {"data": series, "config": {"method": "STL", "params": {"period": 12}}},
    "MSTL": {"data": series, "config": {"method": "MSTL", "params": {"periods": [12, 24]}}},
    "ROBUST_STL": {"data": series, "config": {"method": "ROBUST_STL", "params": {"period": 12}}},
    "EMD": {"data": series, "config": {"method": "EMD", "params": {"primary_period": 12, "n_imfs": 4}}},
    "CEEMDAN": {"data": series, "config": {"method": "CEEMDAN", "params": {"primary_period": 12, "trials": 3, "noise_width": 0.03}}},
    "VMD": {"data": series, "config": {"method": "VMD", "params": {"K": 4, "alpha": 300.0, "primary_period": 12}}},
    "WAVELET": {"data": series, "config": {"method": "WAVELET", "params": {"wavelet": "db4", "level": 3}}},
    "MA_BASELINE": {"data": series, "config": {"method": "MA_BASELINE", "params": {"trend_window": 7, "season_period": 12}}},
    "MVMD": {"data": panel, "config": {"method": "MVMD", "params": {"K": 4, "alpha": 300.0, "primary_period": 12}, "channel_names": ["a", "b", "c"]}},
    "MEMD": {"data": panel, "config": {"method": "MEMD", "params": {"primary_period": 12}, "channel_names": ["a", "b", "c"]}},
    "GABOR_CLUSTER": {"data": series, "skip": "requires a trained GaborClusterModel or model_path plus the experimental clustering backend"},
}

GALLERY_RESULTS = []
def _plot_vector(values):
    arr = np.asarray(values, dtype=float)
    if arr.ndim == 2:
        return arr[:, 0]
    return arr


def _style_gallery_axis(ax, title):
    ax.set_facecolor("#ffffff")
    ax.grid(True, axis="y", alpha=0.22, color="#94a3b8", linewidth=0.8)
    ax.grid(False, axis="x")
    ax.spines["left"].set_color("#cbd5e1")
    ax.spines["bottom"].set_color("#cbd5e1")
    ax.tick_params(colors="#334155")
    ax.set_title(title, loc="left", fontsize=12, fontweight="bold", color="#0f172a")


def run_gallery_case(name):
    case = CASES[name]
    metadata = MethodRegistry.get_metadata(name)
    print(f"{name}: {metadata['summary']}")
    if "skip" in case:
        row = {
            "method": name,
            "status": "skipped",
            "reason": case["skip"],
            "input_mode": metadata["input_mode"],
            "output_shape": "",
            "residual_rmse": np.nan,
        }
        GALLERY_RESULTS.append(row)
        display(pd.DataFrame([row]))
        return

    data = case["data"]
    cfg = DecompositionConfig(**case["config"])
    try:
        result = decompose(data, cfg)
    except Exception as exc:
        row = {
            "method": name,
            "status": "skipped",
            "reason": f"{type(exc).__name__}: {exc}",
            "input_mode": metadata["input_mode"],
            "output_shape": "",
            "residual_rmse": np.nan,
        }
        GALLERY_RESULTS.append(row)
        display(pd.DataFrame([row]))
        return

    original = _plot_vector(data)
    trend = _plot_vector(result.trend)
    season = _plot_vector(result.season)
    residual = _plot_vector(result.residual)
    reconstruction = trend + season + residual
    rmse = float(np.sqrt(np.mean((original - reconstruction) ** 2)))

    row = {
        "method": name,
        "status": "ran",
        "reason": "",
        "input_mode": metadata["input_mode"],
        "output_shape": str(np.asarray(result.trend).shape),
        "residual_rmse": round(rmse, 8),
    }
    GALLERY_RESULTS.append(row)
    display(pd.DataFrame([row]))

    fig, ax = plt.subplots(facecolor="#f8fafc")
    ax.plot(original, label="input", color="#0f172a", linewidth=1.6)
    ax.plot(trend, label="trend", color="#2563eb", linewidth=1.4)
    ax.plot(season, label="season", color="#0f766e", linewidth=1.2)
    ax.plot(residual, label="residual", color="#f97316", linewidth=1.0, alpha=0.85)
    _style_gallery_axis(ax, f"{name} decomposition")
    ax.set_xlabel("time step")
    ax.legend(loc="upper right", ncol=2, fontsize=8, frameon=True, framealpha=0.92)
    fig.tight_layout()
    plt.show()
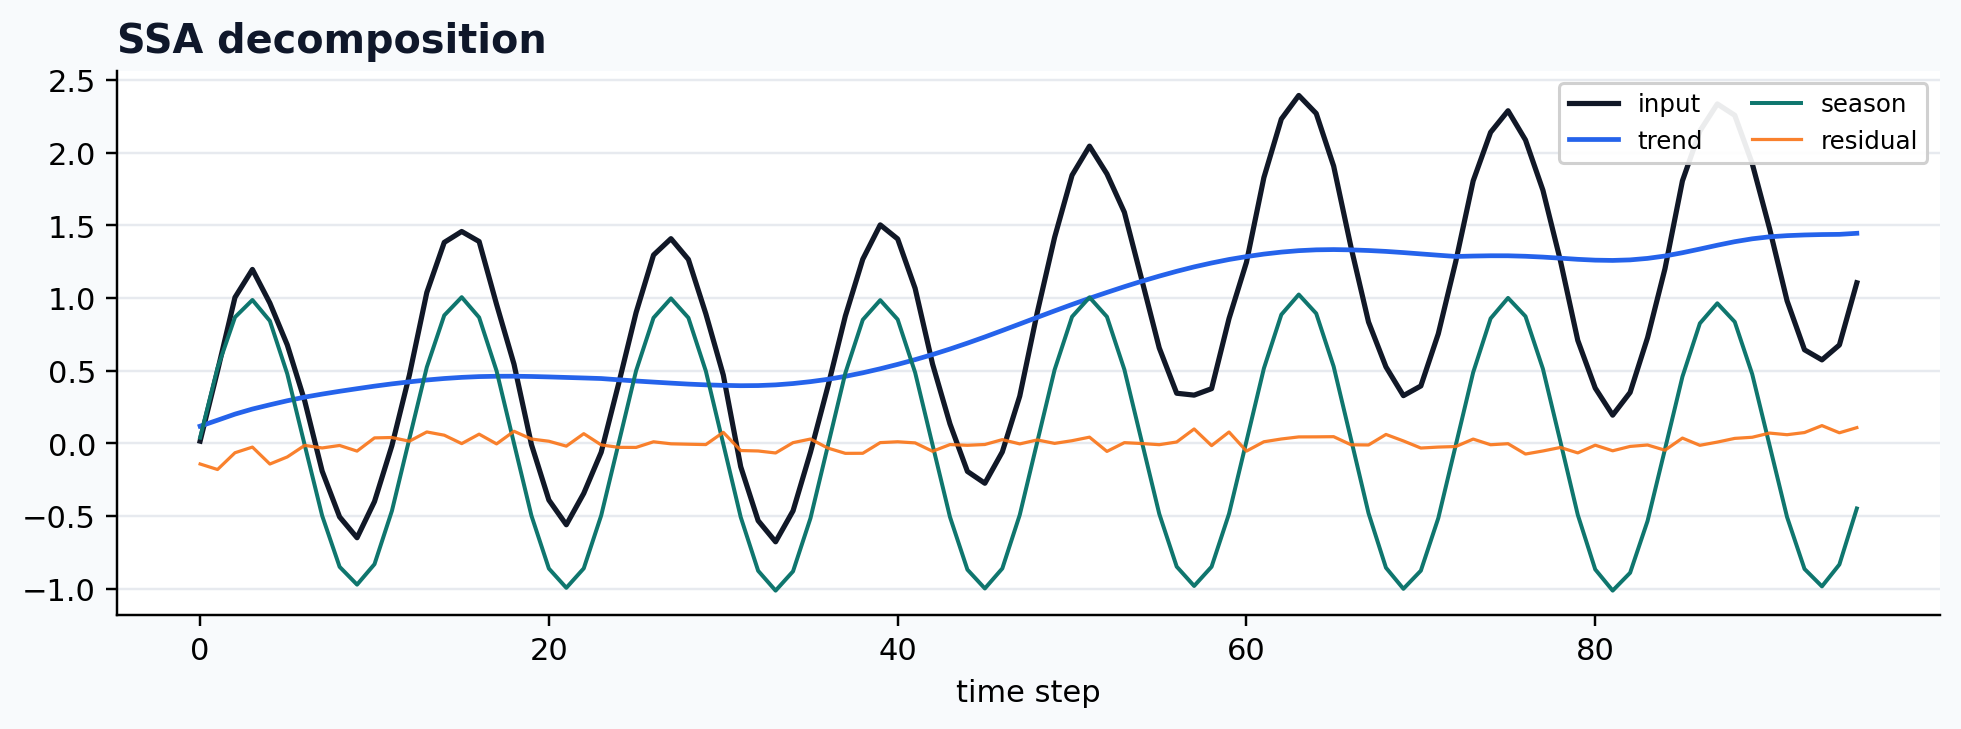
Univariate SSA
case = CASES["SSA"]
run_gallery_case("SSA")
Out:
SSA: Singular spectrum analysis for structured univariate decomposition.
status: ran
input mode: univariate
trend shape: (96,)
backend: native
residual RMSE: 0.00000000
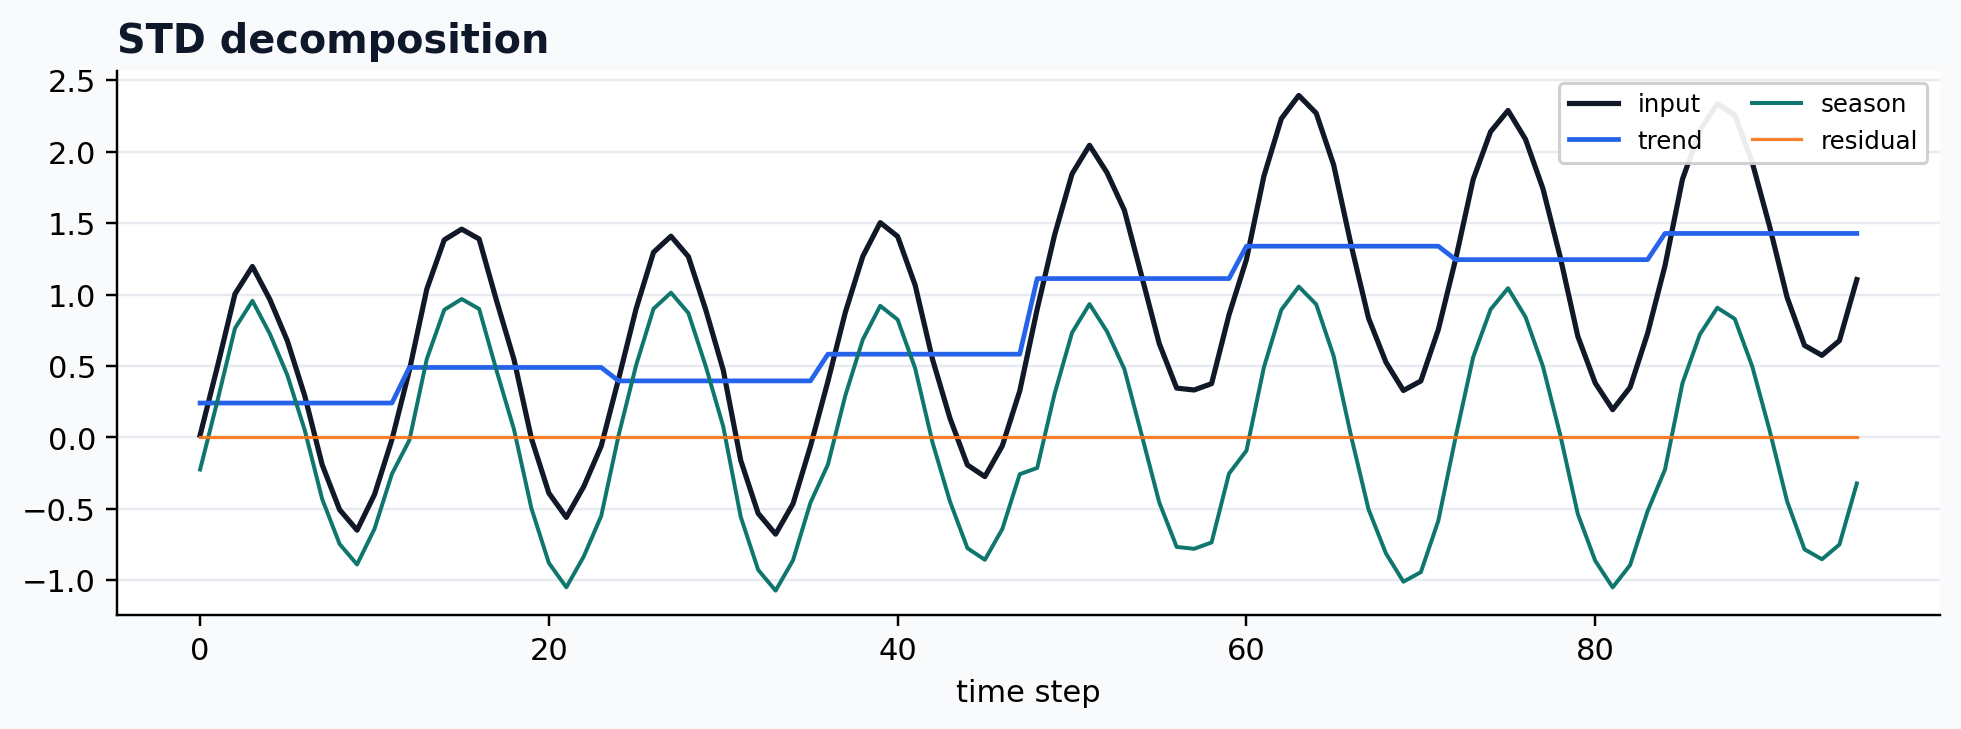
Seasonal-trend decomposition
case = CASES["STD"]
run_gallery_case("STD")
Out:
STD: Fast seasonal-trend decomposition with dispersion-aware diagnostics.
status: ran
input mode: channelwise
trend shape: (96,)
backend: native
residual RMSE: 0.00000000
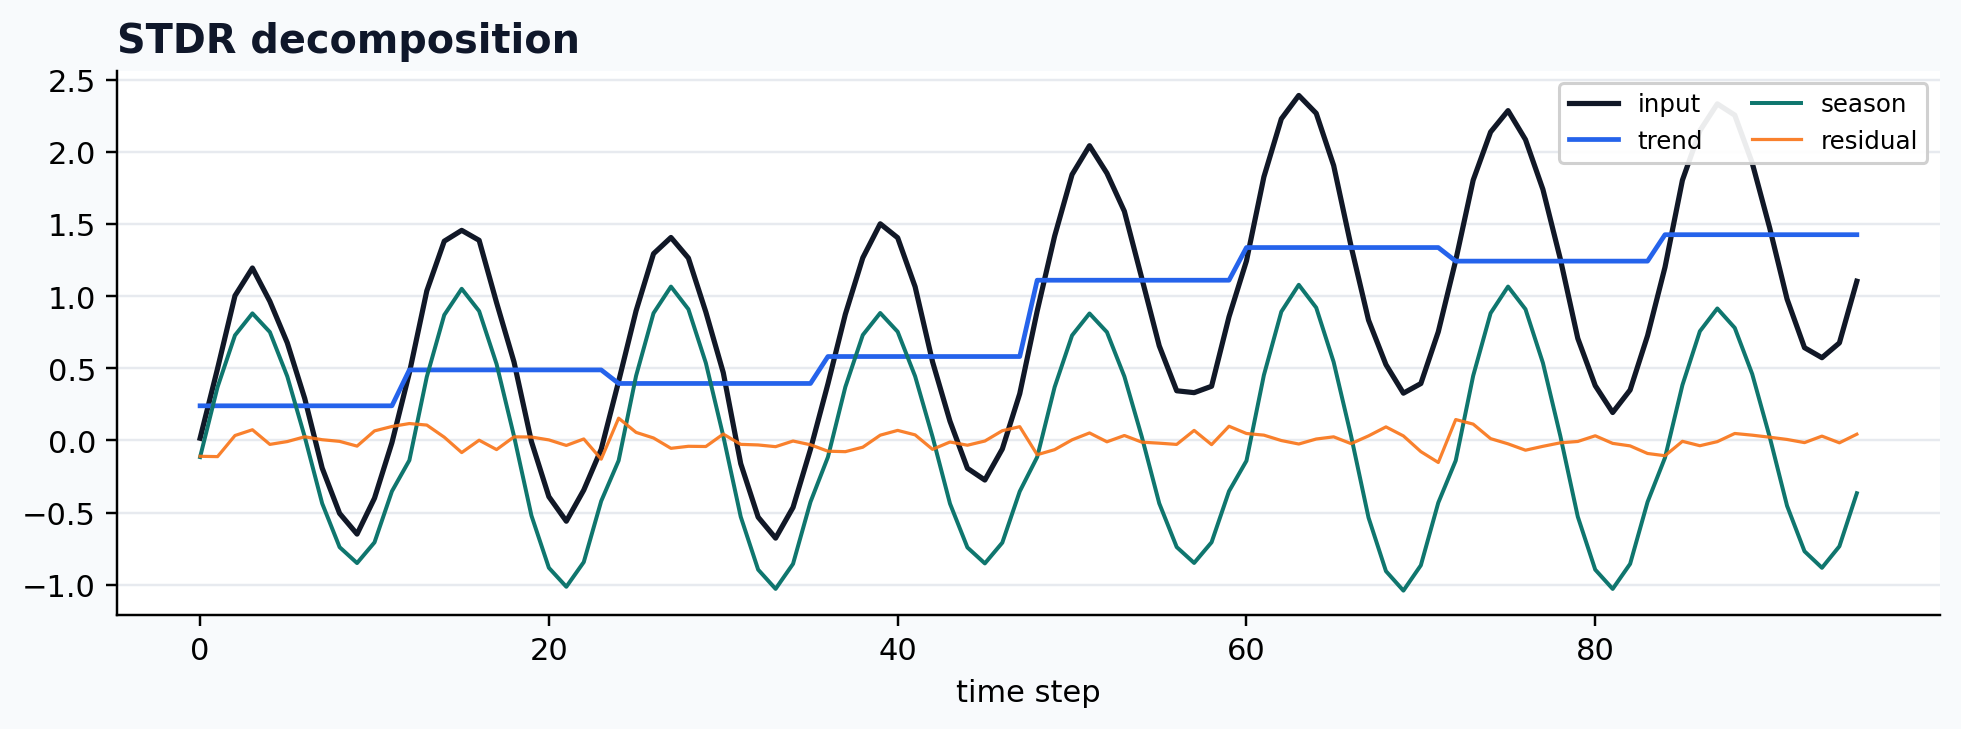
Robust seasonal-trend decomposition
case = CASES["STDR"]
run_gallery_case("STDR")
Out:
STDR: Robust seasonal-trend decomposition for noisier periodic signals.
status: ran
input mode: channelwise
trend shape: (96,)
backend: native
residual RMSE: 0.00000000
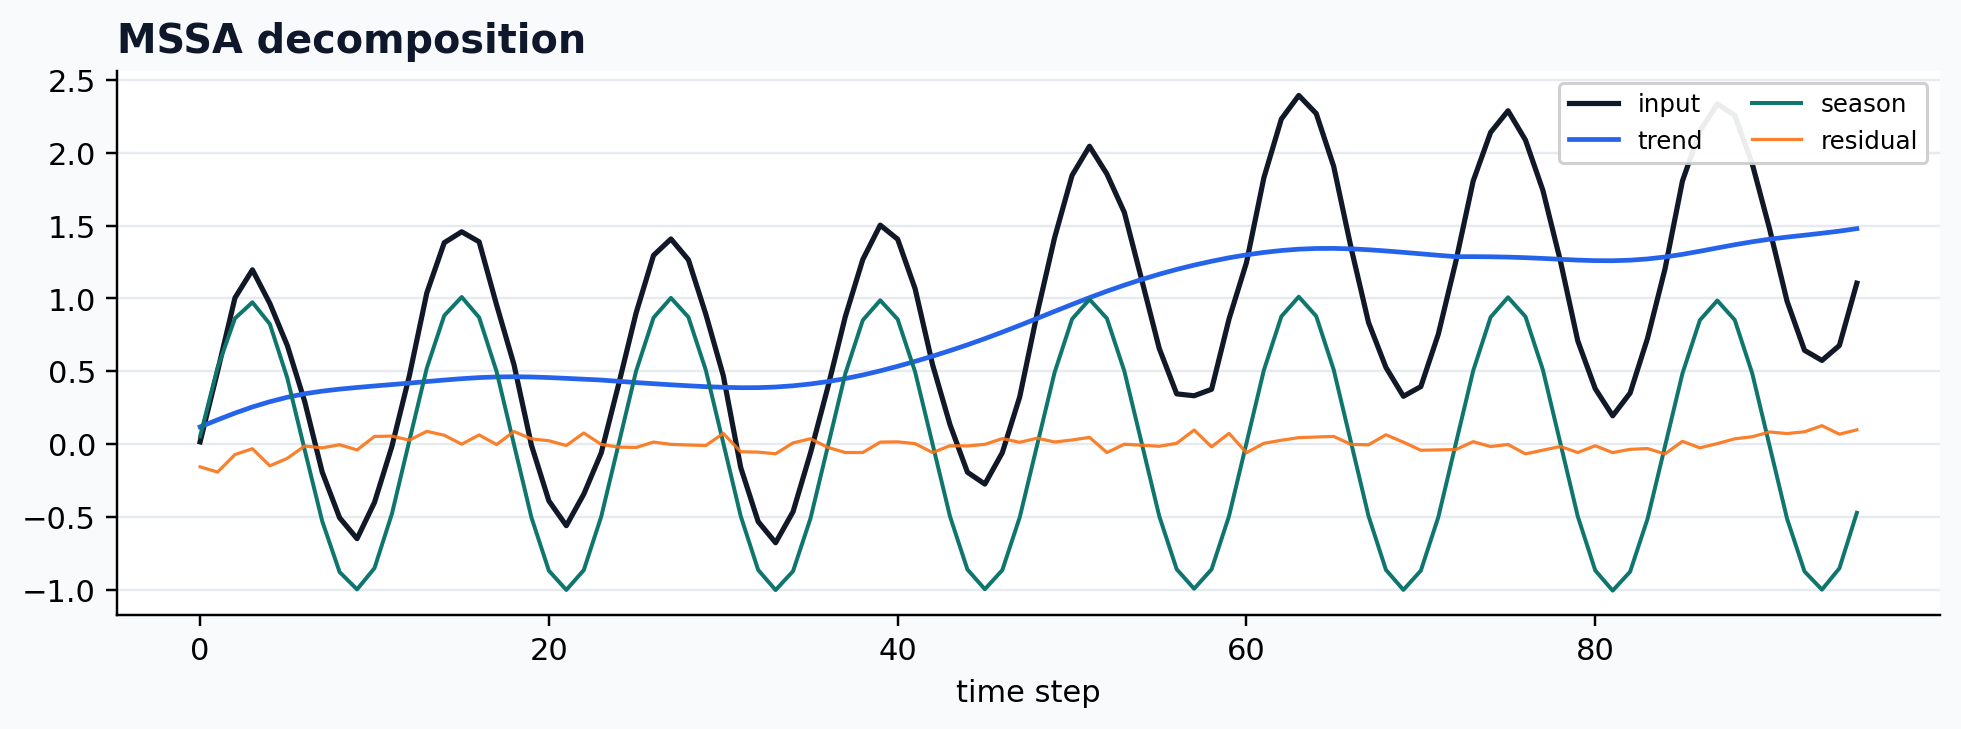
Multivariate SSA
case = CASES["MSSA"]
run_gallery_case("MSSA")
Out:
MSSA: Multivariate SSA for shared-structure decomposition across channels.
status: ran
input mode: multivariate
trend shape: (96, 3)
backend: python
residual RMSE: 0.00000000
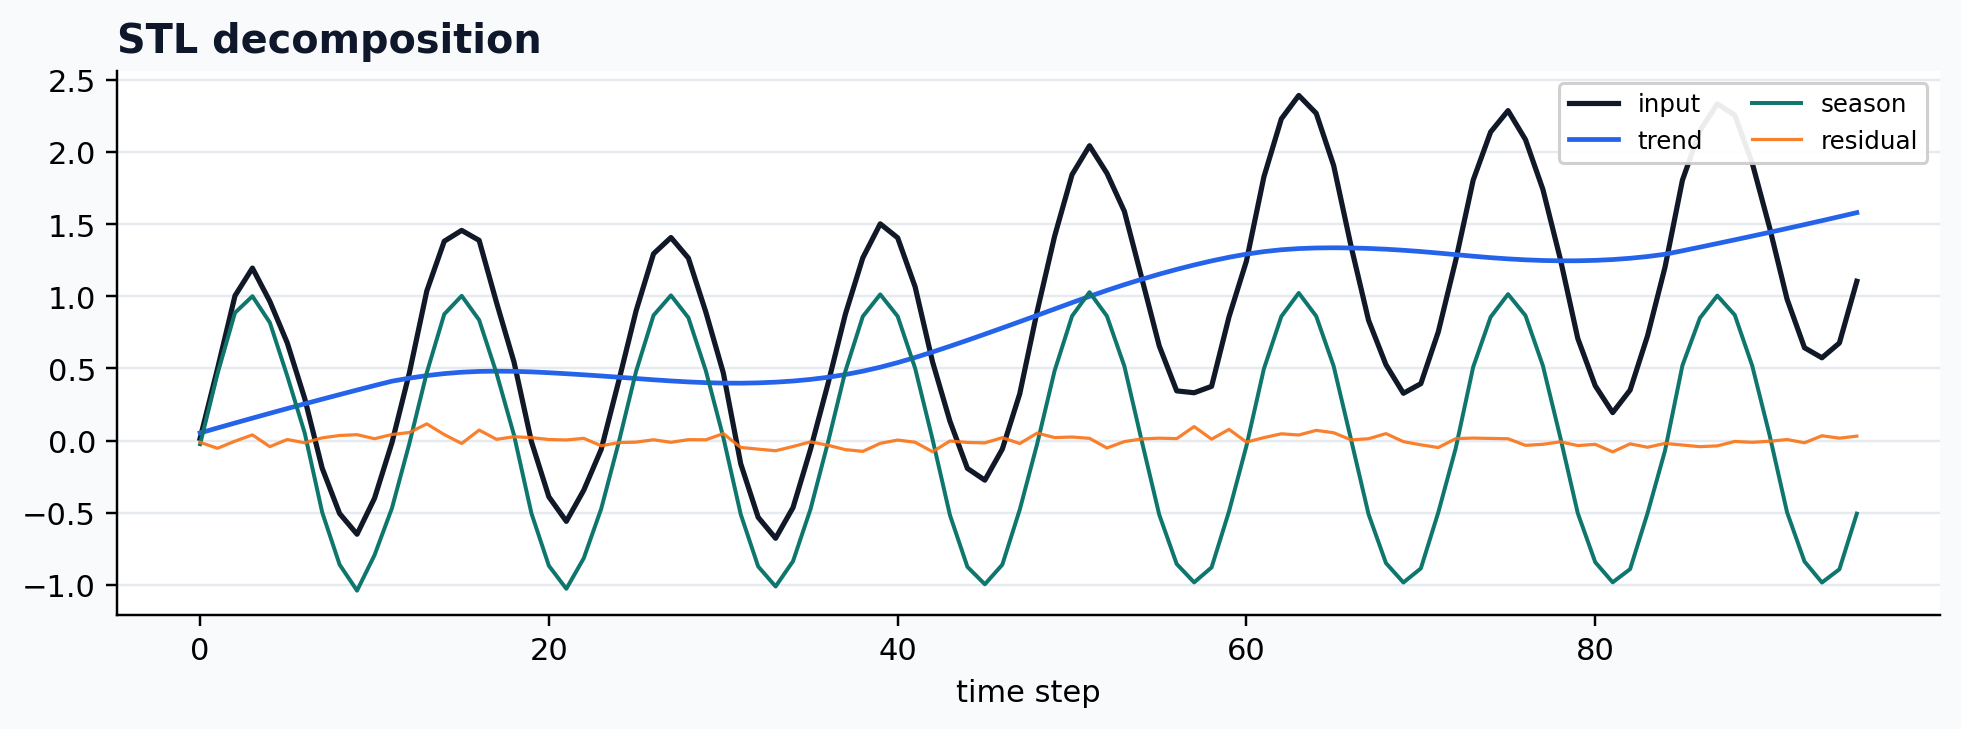
Statsmodels STL wrapper
case = CASES["STL"]
run_gallery_case("STL")
Out:
STL: Classical STL wrapped into the De-Time workflow contract.
status: ran
input mode: univariate
trend shape: (96,)
backend: python
residual RMSE: 0.00000000
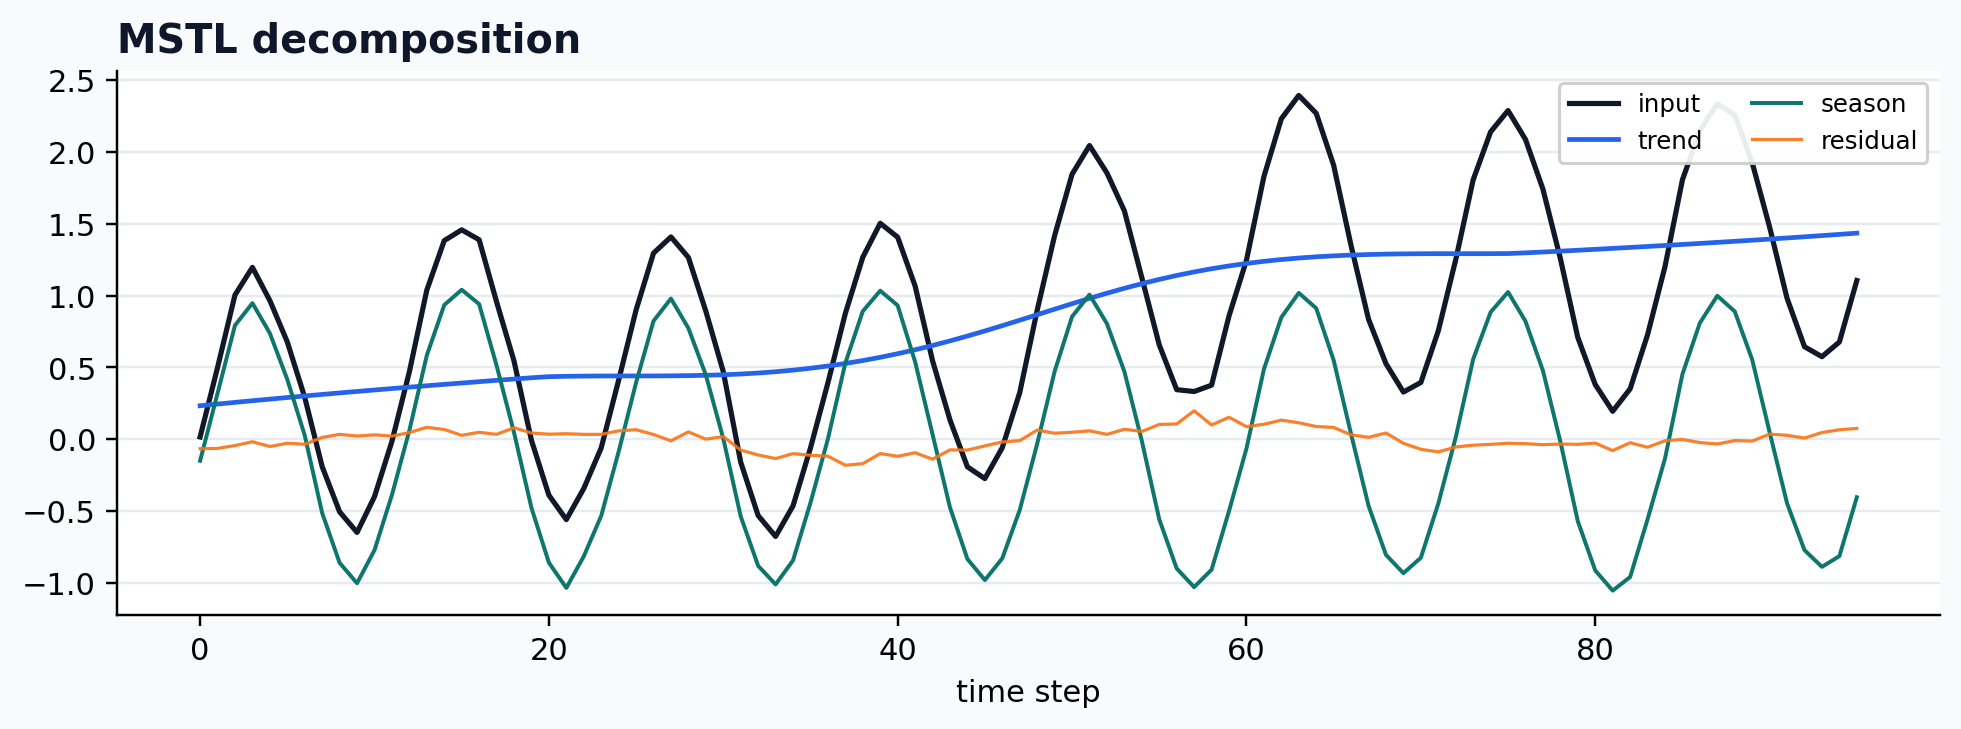
Statsmodels MSTL wrapper
case = CASES["MSTL"]
run_gallery_case("MSTL")
Out:
MSTL: Statsmodels MSTL wrapped into the De-Time workflow surface.
status: ran
input mode: univariate
trend shape: (96,)
backend: python
residual RMSE: 0.00000000
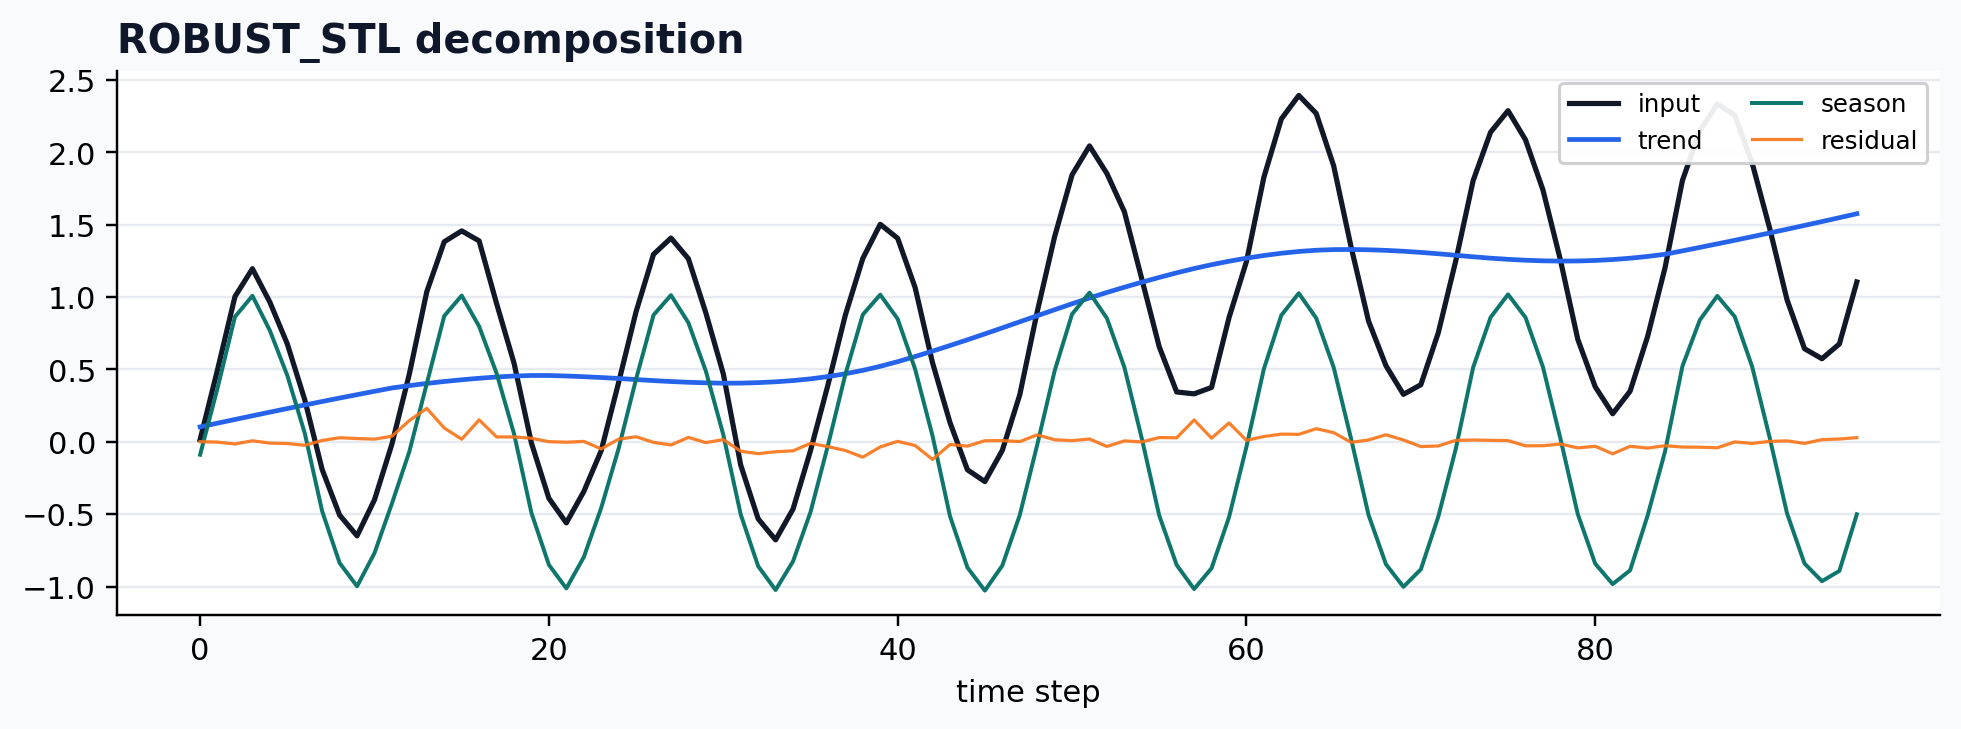
Robust STL wrapper
case = CASES["ROBUST_STL"]
run_gallery_case("ROBUST_STL")
Out:
ROBUST_STL: Robust STL-style decomposition wrapped for reproducible workflows.
status: ran
input mode: univariate
trend shape: (96,)
backend: python
residual RMSE: 0.00000000
Empirical mode decomposition
case = CASES["EMD"]
run_gallery_case("EMD")
Out:
ImportError: PyEMD is required for EMD decomposition. Install 'EMD-signal' or 'PyEMD'.
Noise-assisted EMD
case = CASES["CEEMDAN"]
run_gallery_case("CEEMDAN")
Out:
ImportError: PyEMD>=1.0 is required for CEEMDAN decomposition.
Variational mode decomposition
case = CASES["VMD"]
run_gallery_case("VMD")
Out:
ImportError: vmdpy is required for VMD decomposition.
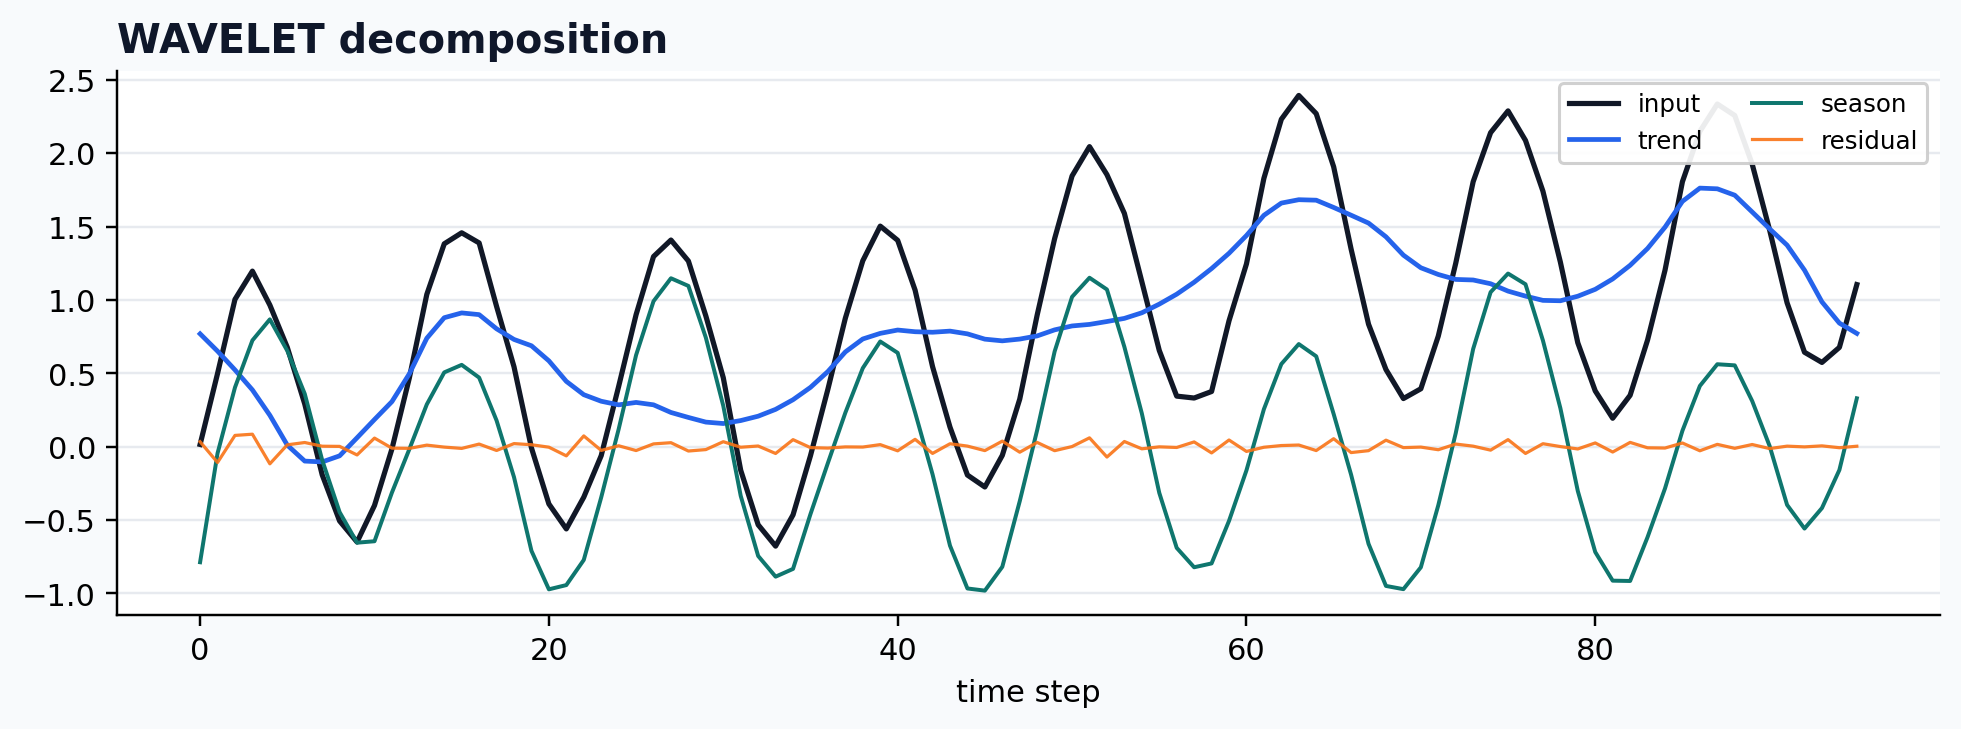
Wavelet decomposition
case = CASES["WAVELET"]
run_gallery_case("WAVELET")
Out:
WAVELET: Wavelet-based decomposition exposed through the common output contract.
status: ran
input mode: univariate
trend shape: (96,)
backend: python
residual RMSE: 0.00000000
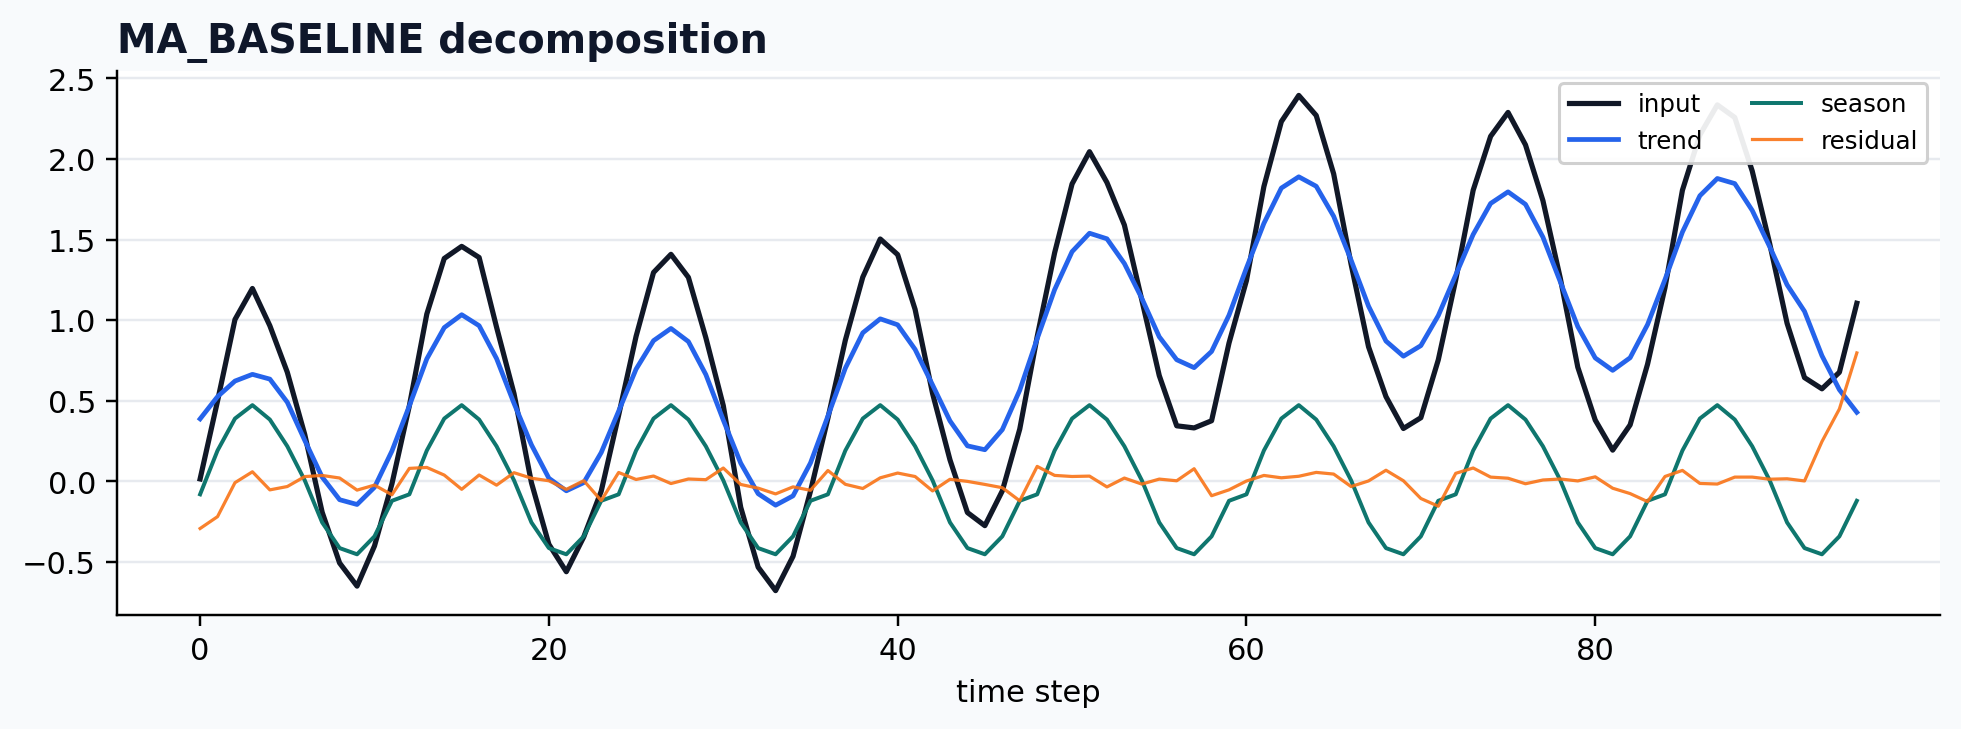
Moving-average baseline
case = CASES["MA_BASELINE"]
run_gallery_case("MA_BASELINE")
Out:
MA_BASELINE: Simple moving-average baseline for smoke tests and lightweight workflows.
status: ran
input mode: univariate
trend shape: (96,)
backend: python
residual RMSE: 0.00000000
Optional multivariate VMD backend
case = CASES["MVMD"]
run_gallery_case("MVMD")
Out:
ImportError: MVMD requires an optional multivariate backend. To use it, reinstall De-Time with the `multivar` extra.
Optional multivariate EMD backend
case = CASES["MEMD"]
run_gallery_case("MEMD")
Out:
ImportError: MEMD requires an optional multivariate backend. To use it, reinstall De-Time with the `multivar` extra.
Experimental Gabor clustering path
case = CASES["GABOR_CLUSTER"]
print(case["skip"])
Out:
requires a trained GaborClusterModel or model_path plus the experimental clustering backend
Summary
| Method | Status | Input mode | Trend shape | Residual RMSE |
|---|---|---|---|---|
SSA |
ran | univariate |
(96,) |
0.00000000 |
STD |
ran | channelwise |
(96,) |
0.00000000 |
STDR |
ran | channelwise |
(96,) |
0.00000000 |
MSSA |
ran | multivariate |
(96, 3) |
0.00000000 |
STL |
ran | univariate |
(96,) |
0.00000000 |
MSTL |
ran | univariate |
(96,) |
0.00000000 |
ROBUST_STL |
ran | univariate |
(96,) |
0.00000000 |
EMD |
skipped | univariate |
`` | n/a |
CEEMDAN |
skipped | univariate |
`` | n/a |
VMD |
skipped | univariate |
`` | n/a |
WAVELET |
ran | univariate |
(96,) |
0.00000000 |
MA_BASELINE |
ran | univariate |
(96,) |
0.00000000 |
MVMD |
skipped | multivariate |
`` | n/a |
MEMD |
skipped | multivariate |
`` | n/a |
GABOR_CLUSTER |
skipped | univariate |
`` | n/a |
Total running time of the gallery script: 1.854 seconds.
Methods run: 9; skipped with explicit reason: 6.
Downloads
Download Jupyter notebook:
de_time_method_gallery.ipynb
Download Python source code: de_time_method_gallery.py
Download zipped example: de_time_method_gallery.zip
The GitHub-rendered notebook is also available at examples/notebooks/de_time_method_gallery.ipynb.